Grid Statistics Plots
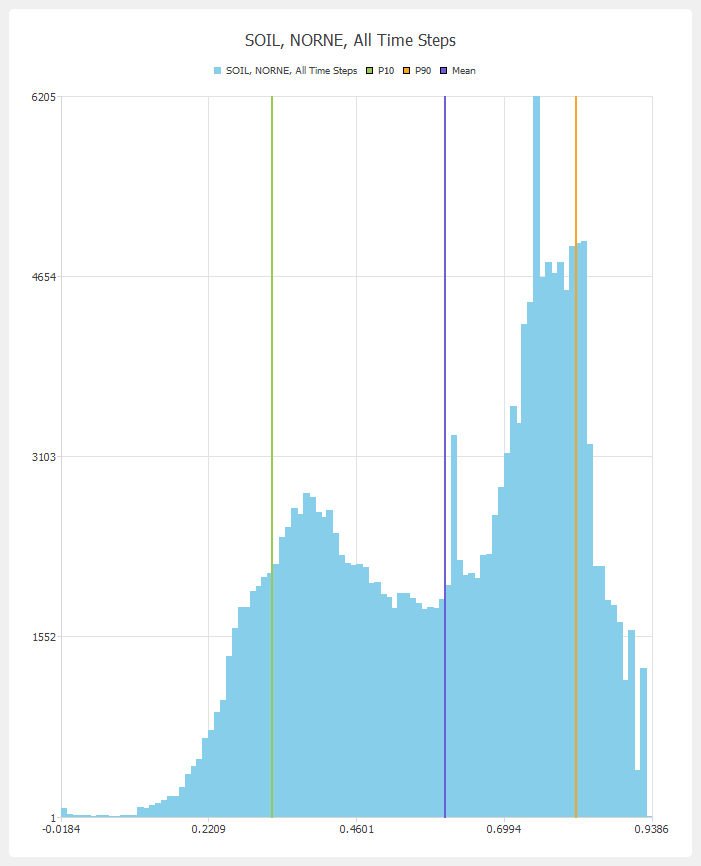
Grid Statistics Plots displays the histogram and statistics values for grid cells.
Creating an Grid Statistics Plot
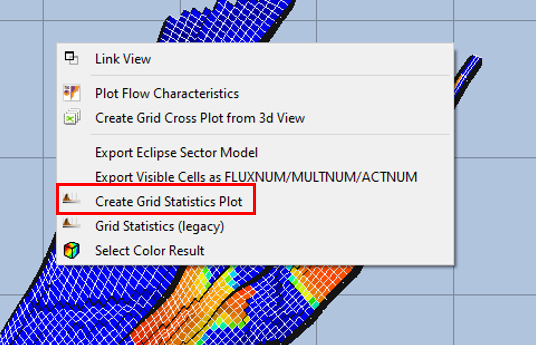
The most convenient way to create an Grid Statistics Plot is often to right-click in the 3D view and invoke Create Grid Statistics Plot as shown below.
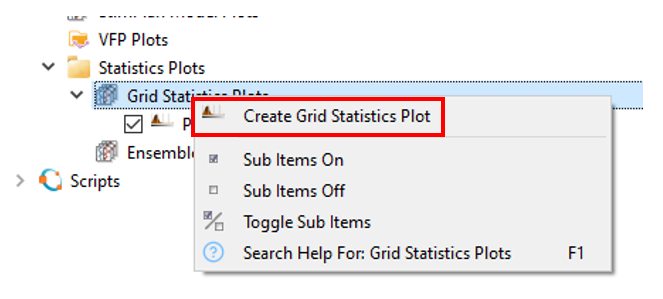
Alternatively, Grid Statistics Plots can be created by right-clicking the Grid Statistics Plots item in Plot Project Tree.
Filter by 3d View Visibility
If you want to display the statistics for a subset of cells, you can select a view to use only the cells visible in that view. This option is activated by selecting a view from the drop down list at Filter by 3d View Visibility