VFP Plot
A Vertical Flow Performance Plot (VFP Plot) shows the relationship between bottom hole well conditions and wellhead pressure describing a well’s ability to lift fluids to the surface. ResInsight can display both production and injection VFP plots.
Creating VFP Plots
VFP Plots are created by right-clicking the VFP Plots item in Plot Project Tree.
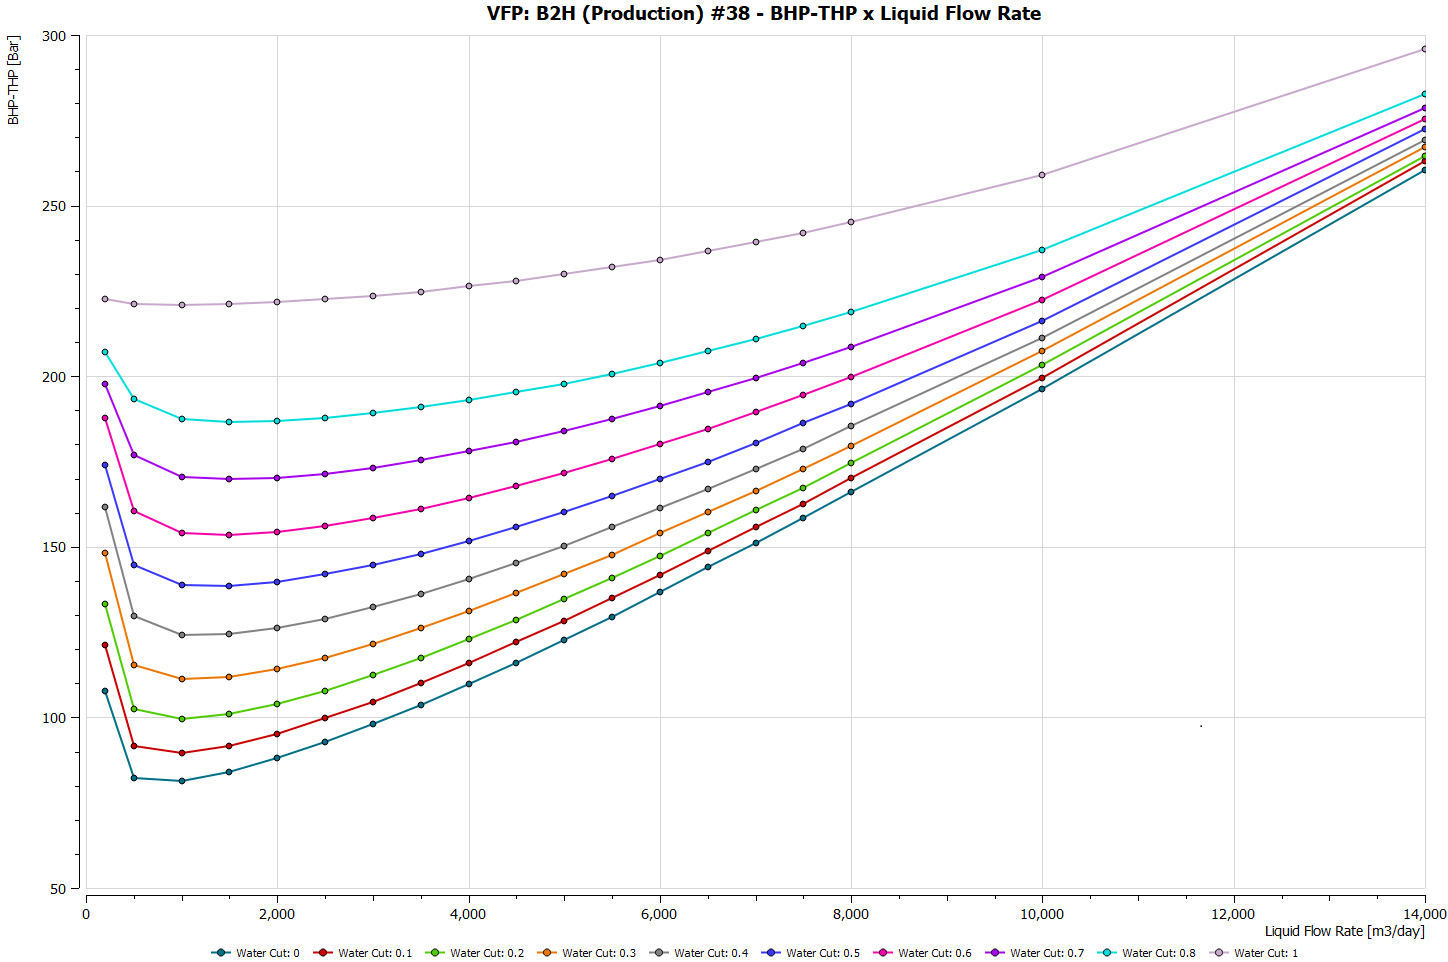
Production VFP Plot
The production VFP Plot shows the outflow or downstream pressure based on the inlet or upstream pressure and the phases flowing through the system. For a well this means the table relates the flowing bottom-hole pressure (BHP) to the well’s tubing head pressure (THP) based on the oil, gas and water rates (and any artificial lift quantities like gas lift gas), or phases ratios, flowing up the wellbore. The data is read from files containing the VFPPROD Eclipse keyword.
The following is an example of a production VFP Plot and corresponding Property Editor.
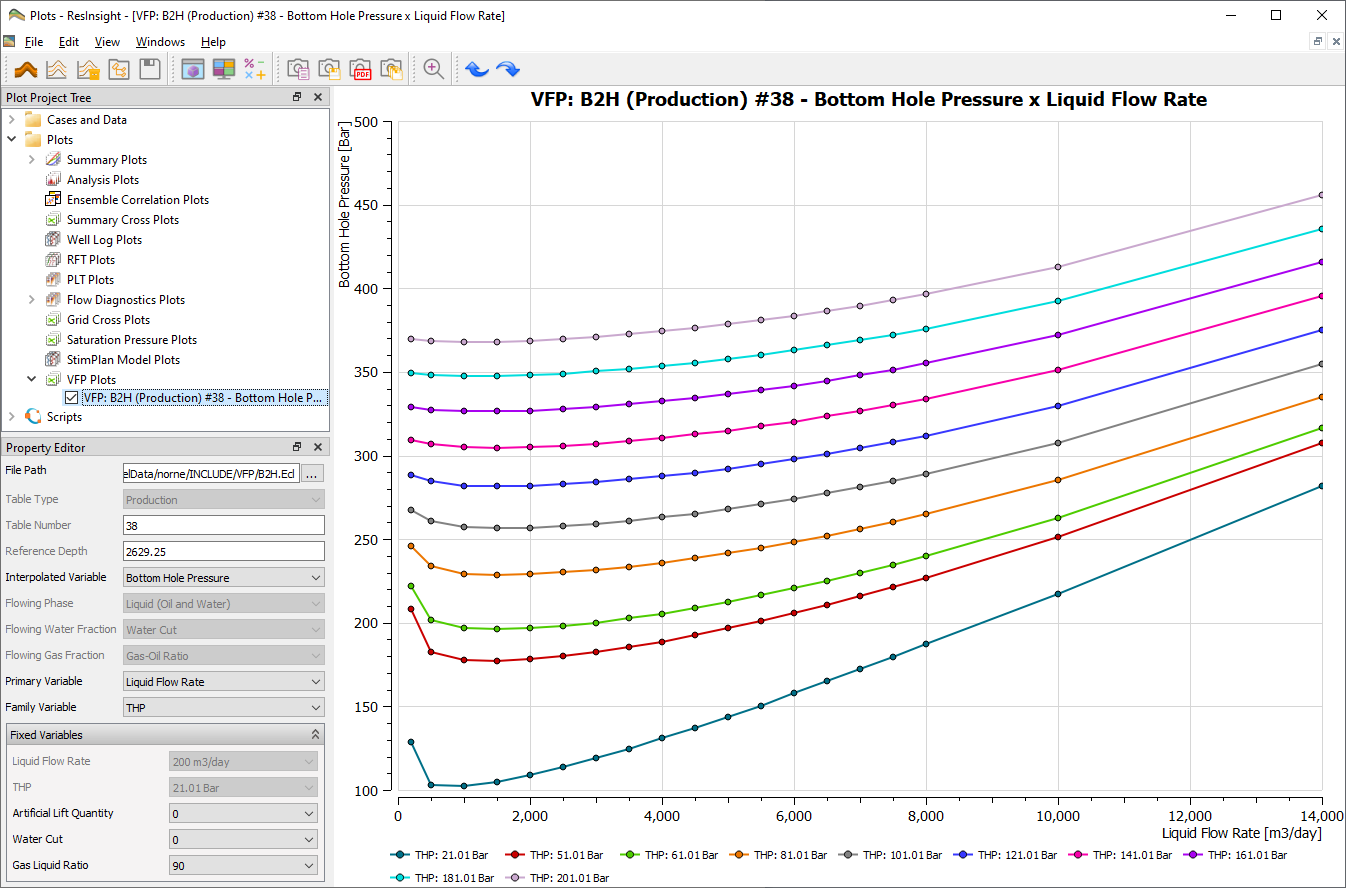
The available settings of the production Property Editor are:
-
File Path: The VFP data file(s) to plot. Multi-selection of files is possible.
-
Table Number: The table number, i.e. VFPTAB keyword in Eclipse data.
-
Reference Depth: The reference depth used to generate the table, i.e. VFPREF keyword in Eclipse data.
-
Interpolated Variable: Y-axis variable.
-
Flowing Phase: The flowing phase in the system, i.e. FLO keyword in Eclipse data.
-
Flowing Water Fraction: Corresponds to the WFR keyword in Eclipse data.
-
Flowing Gas Fraction: Corresponds to the GFR keyword in Eclipse data.
-
Primary Variable: Variable on X-axis.
-
Family Variable: Variable for grouping of properties.
-
Fixed Variables: Used to choose which table to display.
Plot data can be exported by right-clicking the actual plot and selecting Show Plot Data.
Injection VFP Plot
The Injection VFP Plot shows the outflow or downstream pressure based on the inlet or upstream pressure and the phases being injected into the system. For a well this means the table relates the flowing bottom-hole pressure (BHP) to the well’s tubing head pressure (THP) based on the oil, gas or water injection rates. The data can be read from files containing the VFPINJ Eclipse keyword.
The following is an example of a production VFP Plot and corresponding Property Editor.
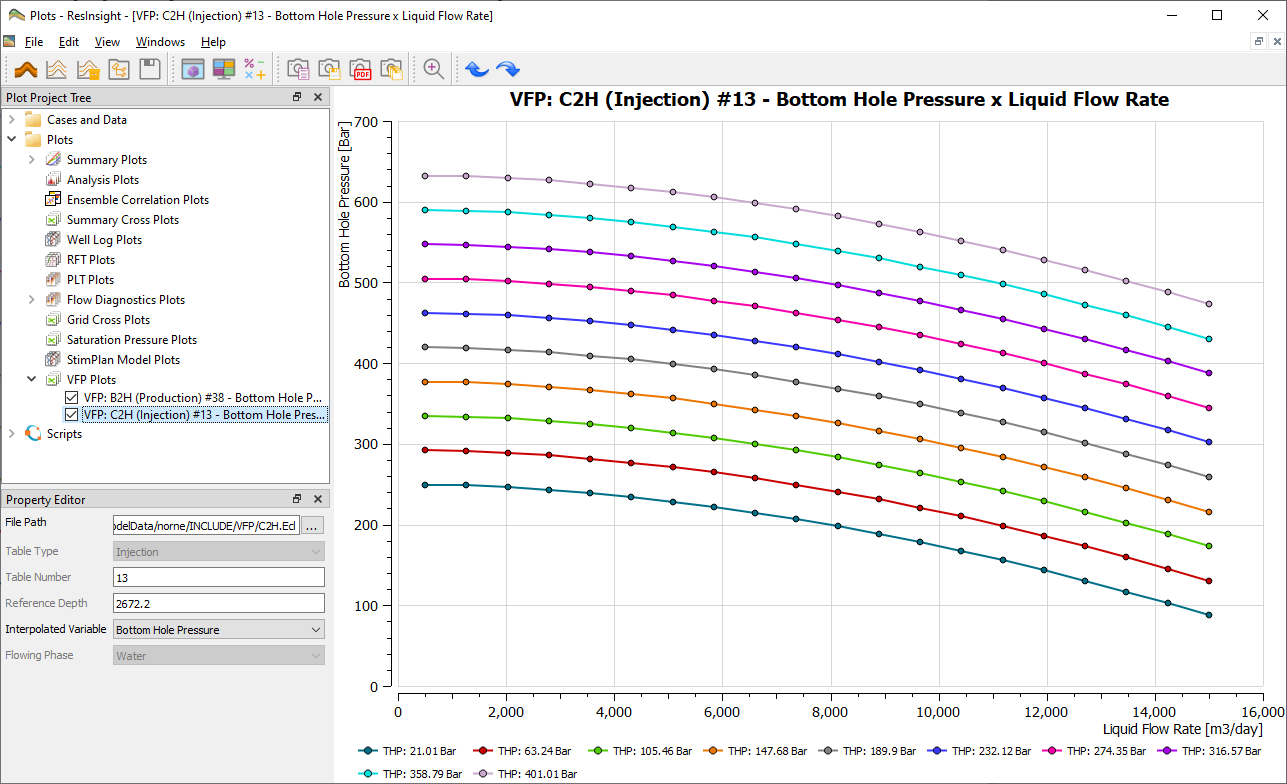
The available settings of the injection VFP Property Editor are:
-
File Path: The VFP data file(s) to plot. Multi-selection of files is possible.
-
Table Number: The table number, i.e. VFPTAB keyword in Eclipse data.
-
Reference Depth: The reference depth used to generate the table, i.e. VFPREF keyword in Eclipse data.
-
Interpolated Variable: Y-axis variable.
-
Flowing Phase: The flowing phase in the system, i.e. FLO keyword in Eclipse data.
Plot data can be exported by right-clicking the actual plot and selecting Show Plot Data.