3D Well Log Plots
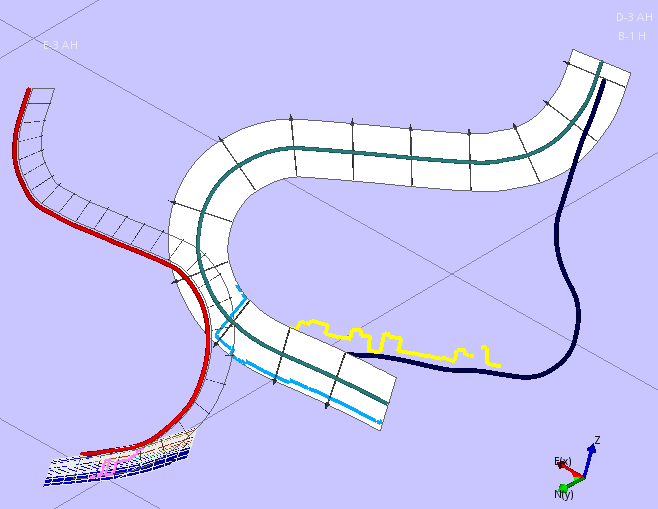
ResInsight can display well logs curves directly in the 3D view with a subset of the functionality of the full 2D Well Log Plot Editor. The curves will be drawn in a plane next to or centered on the well trajectory they belong to and can display well log data from a simulation model and from imported LAS-files.
Creating new 3D Well Log Curves
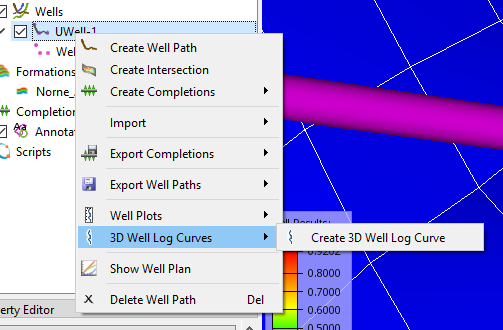
Add a new 3D well log curve by selecting a Well Path in the Project Tree, right-clicking and selecting 3D Well Log Curves and Add 3D Well Log Curve.
Deleting 3D Well Log Curves
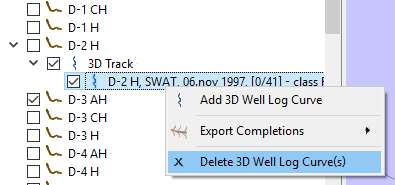
Delete one or more 3D well log curves by selecting them in the project tree, right-clicking on one of the selected items and choosing Delete 3D Well Log Curve(s). The curves will be deleted with no further confirmation.
Configurating the 3D Well Log Curves
3D Track and Draw Plane Appearance
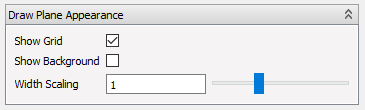
Each 3D well log curve belongs to a 3D Track which in turn is attached to a well path. The 3D track itself contains some settings related to the display of the curves.
| Parameter | Description | Range |
|---|---|---|
| Show Grid | Show axis markers for the value-axis of the curves along the draw surface | True/False |
| Show Background | Draw a white background on the drawing surfaces of the curves | True/False |
| Width Scaling | A scaling factor applied to the width of the draw surfaces | [0.25, 2.5] |
Curve Configuration
In addition to the 3D track configuration, each 3D well log curve may be configured in its Property Editor. Here settings are grouped into three categories: Data Selection, Appearance and Name Generation.
Data Selection
The Curve Data configuration allows you to select a case, result type, property and time step to plot.
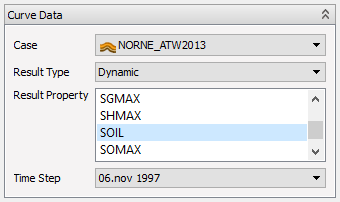
| Parameter | Description |
|---|---|
| Case | The eclipse or geomechanical case to retrieve the data from |
| Result Type | Dynamic, static, generated, input property, formation names, flow diagnostics or injection flooding |
| Result Property | The parameter to plot |
| Time Step | Which time step to show |
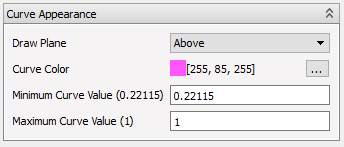
Appearance
In the Curve Appearance box, the curve can be assigned to a draw plane, the color can be changed and a range of curve values applied. The range of the result property can be set with the minimum and maximum curve value settings. The curve range is by default set to the minimum and maximum values found in the data set and these values are retained in the label if different values have been chosen.
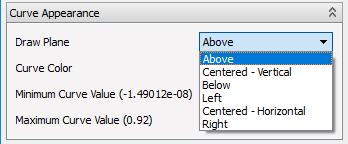
The draw plane can be vertical (above well path, centered and below well path) and horizontal (left, centered and right). If multiple curves are added and assigned to the same draw plane, they will appear in the same curve plot.
Name Generation
Finally the name of the curve is created automatically from a set of parameters such as case, view, etc. The parameters that should make up the curve name can be selected in the Curve Name box. Only extraction log curves have multiple settings here. The automatic name generation will be automatically switched off if the curve has been renamed manually and can be switched back on by checking the Generate Name Automatically tick box.