Streamlines
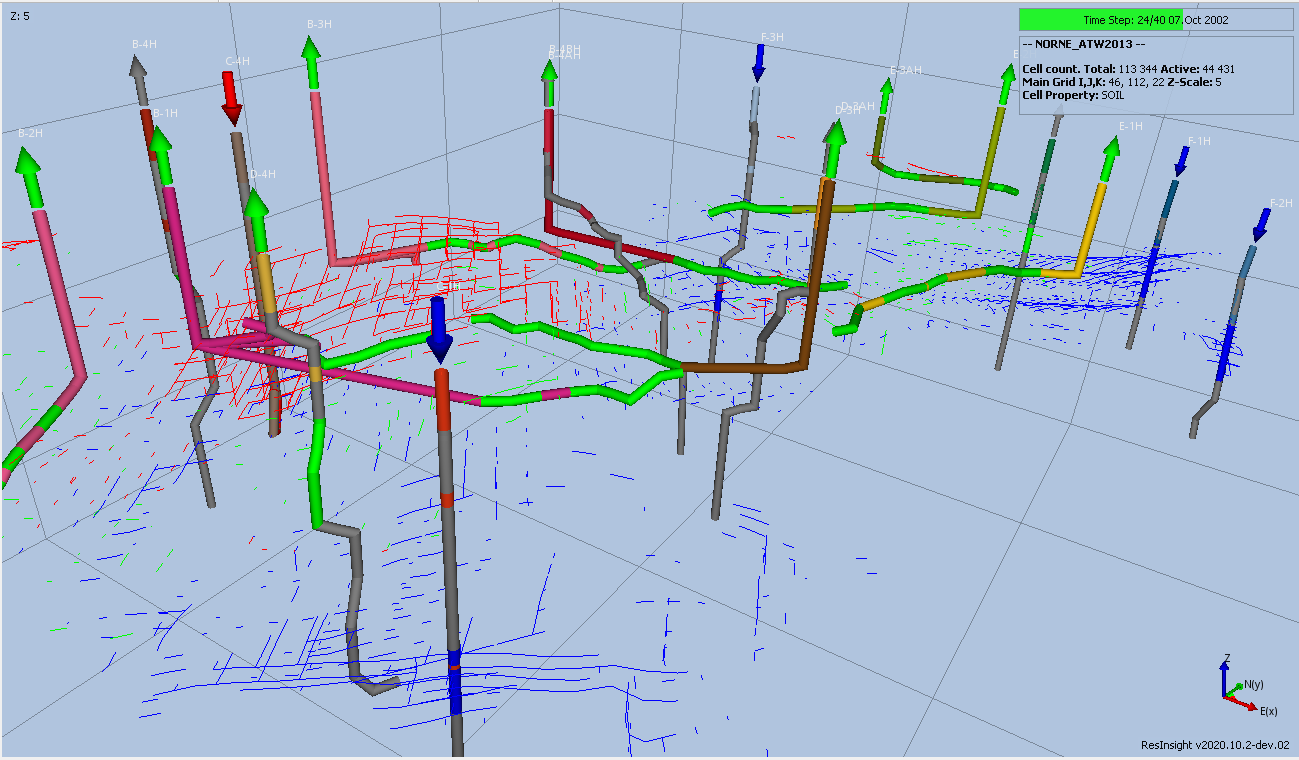
Streamlines lets the user investigate the flow of different phases through a reservoar. It allows for selecting both an individual phase or a combination of phases colored by the dominant phase or velocity. The visualization and animation of streamlines requires the Eclipse properties FLRGASI/J/K FLRWATI/J/K FLROILI/J/K.
Displaying Streamlines
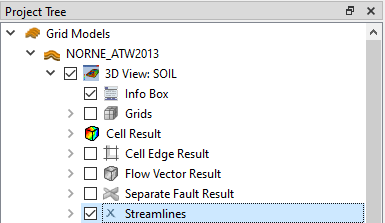
To display streamlines, select a time step and check the Streamlines checkbox in Project Tree.
Property Editor
The display and animation of streamlines is controlled by the Property Editor.
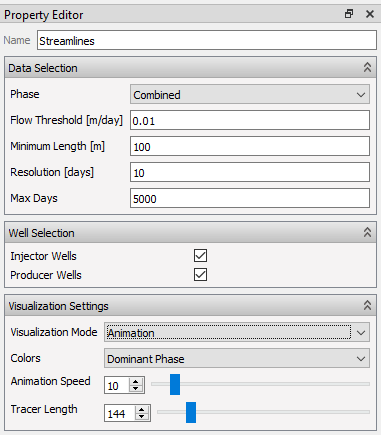
The following groups of settings control the content, display and animation of streamlines:
Data Selection
- Phase: Selection of an individual phase (Oil, Gas, Water) or Combined display.
- Flow Threshold: Minimum flow threshold calculated as I/J/K flow rate divided by corresponding face area.
- Minimum Length: Minimum length of streamlines in meters.
- Resolution: Resolution of streamline animation in days (governing the number of individual animation steps).
- Max Days: Maximum calculation range in days for streamline animation.
Well Selection
- Injector Wells: Calculate streamlines stemming from injector wells.
- Producer Wells: Calculate streamlines backtracing from producer wells.
Visualization Settings
- Visualization Mode: Perform an animation of streamlines or manually control the display.
- Colors: Color the streamlines by dominant phase or by velocity.
- Animation Speed: Adjust the speed of streamline animation.
- Tracer Length: Adjust the length of the individual tracers pertinent to a streamline.
In case Visualization Mode is set to Manual control, the setting Animation Index replaces the two latter settings. Animation Index allows for displaying an individual animation step.
Algorithm in brief
Streamlines are generated by starting in open injector well cells and tracing out through the face with the largest flow rate (in m/day) into the next cell and so on. If flow rates above the given threshold exists for multiple cell faces, additional trace branches are spawned off for those faces. The distance between each point added to a trace is controlled by the resolution, as $ distance = rate * resolution $. The trace ends when either:
- the flow goes below the user specified threshold
- the maximum number of days since the start of the trace have been reached
- a cell that already has a trace in it is encountered
- an active well cell is encountered
Streamlines could also be generated using production wells as starting cells. In that case, the flow is reversed and the flow is traced backwards from the starting well using the same algorithm as for injector wells. Once reaching the end, the trace is reversed again to have the flow go into the production well in the final streamline.