Contour Map Export
ResInsight can create contour maps based on different forms of aggregation of 3D reservoir simulation data onto a 2D Plane. Any 3D result value can be aggregated, in addition to specialised results, such as oil, gas and hydrocarbon columns. A Contour Map is a specialised 2D view with many of the same features as the 3D views, including property filters, range filters and display of faults and wells.
Export of Contour Map Data
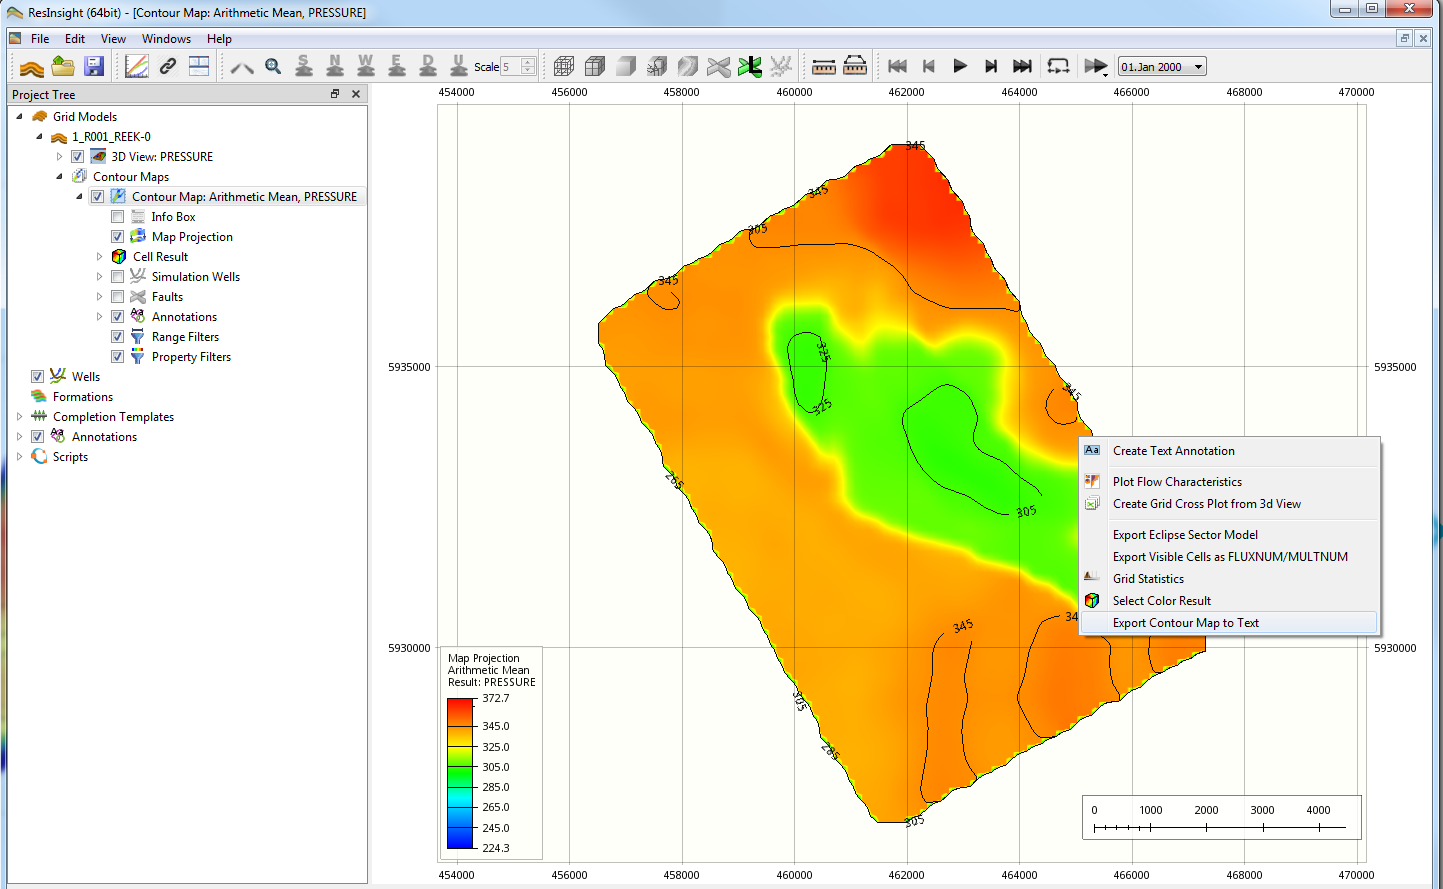
To export a contour map, invoke one of the following options (c.f. figure above):
- Select right-click command Export Contour Map to text in the graphics window showing a contour map.
- Select right-click command Export Contour Map to text for a contour map in the Project Tree
This initiates the following dialog for export options:
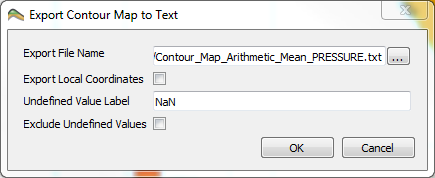
As seen, the dialog facilitates the following options:
- Setting the file name for export.
- Export of local coordinates, i.e. coordinates measured from local origo defined in lower, left corner of contour map. Default is export of full UTM coordinates.
- Defining a text label to exclude undefined values. Default label is NaN.
- Exclude undefined values based on the given label.
Export file format
The file format for export of contour maps supports use of Python and numpy. For instance, an exported file may can be imported into numpy using the loadtxt() function.
Metadata is included as comments in the beginning of the file. The character # as first character denotes a comment line.
If local coordinates are exported, the UTM coordinate offset is included as a comment in the header of the export file (c.f. example file below). To anonymize the data, the UTM coordinate offset may be removed from file.
Example file:
Python interface for export of contour maps
The ResInsight Python API allows the user to access all contour maps belonging to a project. A Python script for exporting contour maps to a text file is included as one of the examples of the ResInsight Python API.