Observed Time History Data
Observed Time History Data, is data measured in time. On import of observed time history data, ResInsight translates the data to make it similar to summary data. Observed time history data can be plotted along with summary data in Summary Plots.
Import Observed Time History Data
Importing observed time history data to ResInsight may be performed in two different ways:
- By selecting the main menu item File -> Import -> Import Observed Data
- By using the right-click command Import Observed Data on the Observed Data item in the Plot Main Window Project Tree
The following file types are supported:
- RSM observed time history data file (*.rsm)
- Column based (Comma Separated Values, CSV) time history data file (*.csv/*.txt)
The imported
 Observed Data files will be added to
 Observed Data.
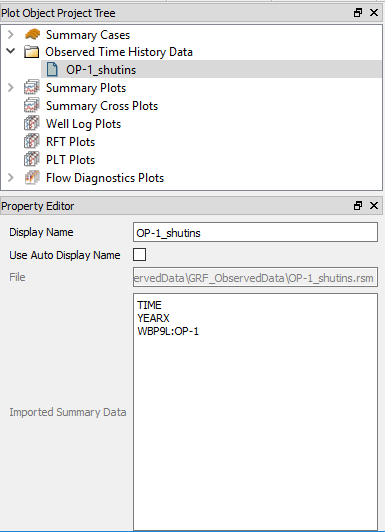
Which summaries that has been detected in a Observed Data file can be read in an Observed Data’s Property Editor. In the image below, time and year info has been found together with the summary “WBP9L” for the well “OP-1”.
Viewing Observed Time History Data
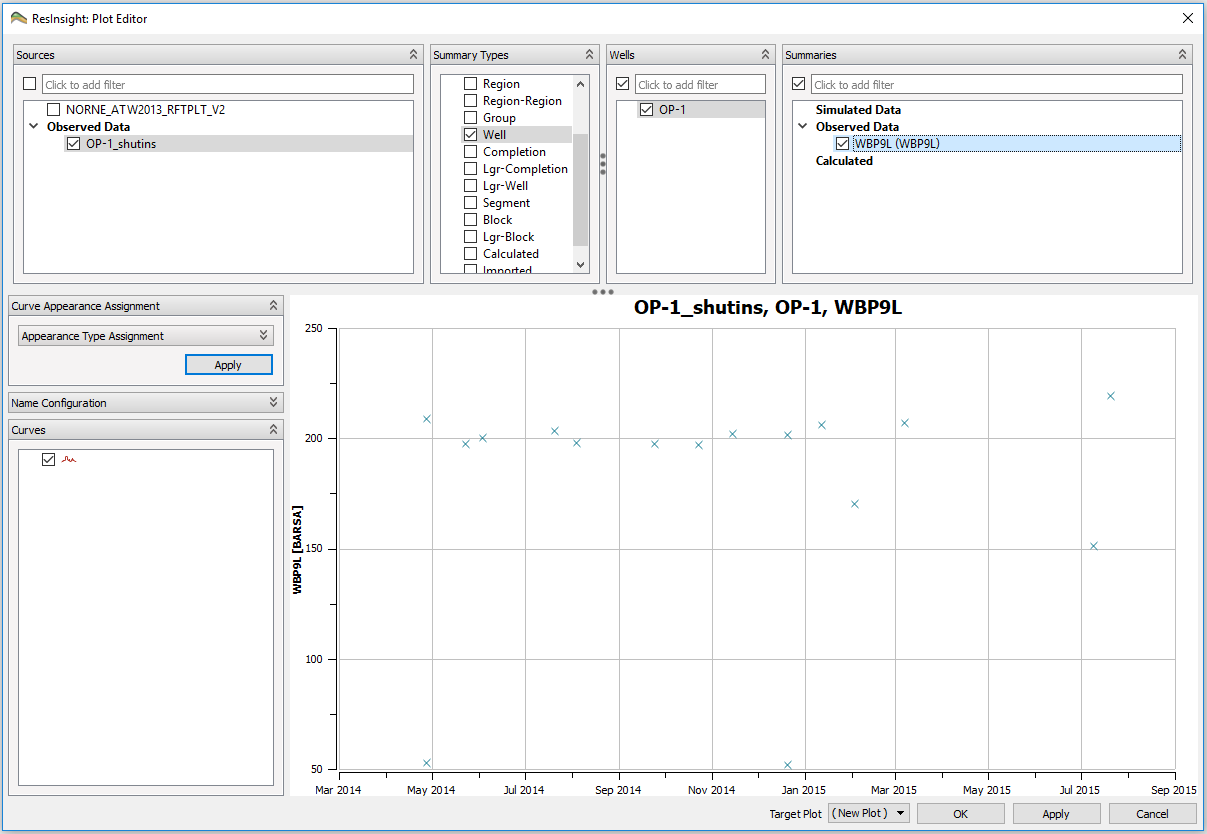
To plot Observed Time History Data, choose New Summary Plot in the right-click menu of Summary Plots, in Plot Object Project Tree. Observed time history data will appear in Sources together with summary cases. How to use the Plot Editor is covered in Summary Plot Editor. Observed time history data points are plotted without lines by default.
When inspecting resampled data, it can be useful to manually specify if this curve is Accumulated or Rate. Summary Curve Properties.
File Formats
Import CSV/txt Observed Time History Data
CSV/txt files are generic ascii files where data is arranged in columns. Some variations in formatting is supported, for instance deifferent cell separators, date and time format, decimal separator etc. When importing these types of files the user is presented a dialog, where the user may tell ResInsight how to import the selected file(s). If more than one file is selected, the dialog appears once for each file.
CSV/txt Import Options Dialog
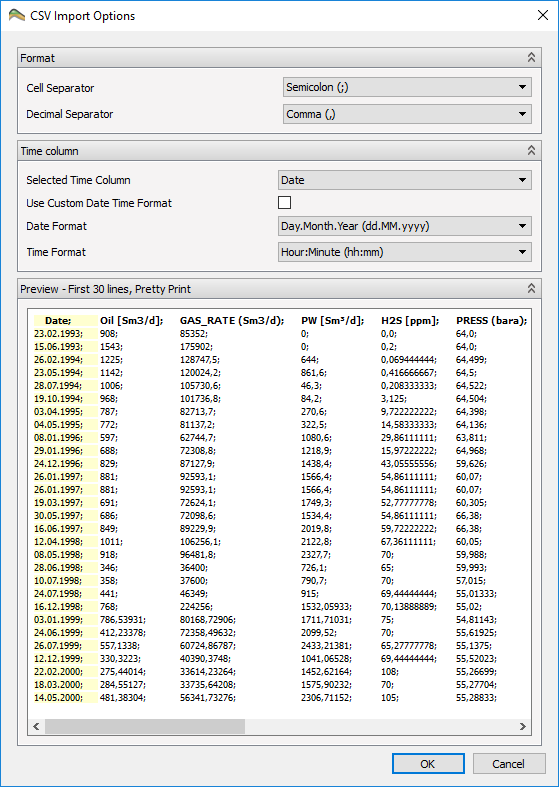
Dialog fields description:
- Cell Separator – Select the correct cell separator character. ResInsight will try to set the correct value as default.
- Decimal Separator – Select the correct decimal separator. ResInsight will try to set the correct value as default.
- Selected Time Column – Select the column that contains the time/date information. The first column is default.
- Use Custom Date Time Format – Check this box if the Date Format and/or Time Format in the file do not match any of the most common formats.
- Custom Date Time Format – Enter date time format to match the time information in the file. This field is visible only when the above check box checked. A tooltip will tell the user how to enter the correct information.
- Date Format – Select the date format matching the date information in the file.
- Time Format – Select the time format matching the time information in the file. If the file contains dates only, this field is ignored by ResInsight.
- Preview – Preview the first 30 lines of the file contents. The view will reflect the currently selected Cell Separator and the selected time column is marked in yellow.
Column data
Each column must have a header text, which may be a name/description for the data in the column. By formatting the header text to a valid simulation address, ResInsight recognizes the column data and will be able to categorize the data in the same way as grid data. So when plotting these data later, the user will find the data in the correct category in the Summary Plot Editor.
Simulation address format
A simulation address consists of a vector name and zero or more parameters. The number of parameters are defined by the category of the vector. The category is determined by looking up the category in an internal vector table. A valid standard vector name has 3 to 5 characters. Optionally it may be postfixed by a user defined name of 3 characters. A vector name having both a standard part and a user part must have 8 characters (5+3). In this case, if the standard part has less than 5 characters, it must be padded with underscores up to 5 characters. Example: ‘RPR__WEL’. Vector names having only the standard part are not padded.
Categories:
- Field - <VECTOR ‘F….'>
- Example: ‘FOPT’
- Aquifer - <VECTOR ‘A….’>:<AQUIFER NUMBER>
- Example: ‘AAQR:1’
- Network - <VECTOR ‘N….'>
- Misc - <VECTOR ‘….'>
- Region - <VECTOR ‘R….’>:<REGION NUMBER>
- Example: ‘RPR:1’
- Region to Region - <VECTOR ‘R.F..’>:<REGION NUMBER>-<REGION NUMBER>
- Example: ‘ROFR:1-2’
- Group - <VECTOR ‘G….’>:<GROUP NAME>
- Example: ‘GOPR:MANI-B1’
- Well - <VECTOR ‘W….’>:<WELL NAME>
- Example: ‘WOPR:B-2H’
- Completion - <VECTOR ‘C….’>:<WELL NAME>:<I>,<J>,<K>
- Example: ‘COFRL:C-1H:26,44,16’
- LGR Completion - <VECTOR ‘LC…’>:<LGR NAME>:<WELL NAME>:<I>,<J>,<K>
- Example: ‘LCWIT:WELLI1:I1:5,5,5’
- LGR Well - <VECTOR ‘LW…’>:<LGR NAME>:<WELL NAME>
- Example: ‘LWWIR:WELLI1:I1’
- Segment - <VECTOR ‘S….’>:<WELL NAME>:<SEGMENT NUMBER>
- Example: ‘SOFR:B-5H:32’
- Block - <Vector ‘B….’>:<I>,<J>,<K>
- Example: ‘BPR:15,18,21’
- LGR Block - <VECTOR ‘LB…’>:<LGR NAME>:<I>,<J>,<K>
- Example: ‘LBOSAT:CENTER:5,5,5’
- Imported - <SOME NAME>
When ResInsight parses a simulation address, it first tries to identify an address category by analyzing the vector name, as described above. If no category could be found, the Imported category is used. This category is also used if the address format is wrong (for instance missing parameters) even though the vector name identifies a different category.
Instantaneous vs Accumulated Data
A valid simulation vector having a standard name ending with ‘T’ or ‘TH’ are considered accumulated data. In the summary plot, these types of data are plotted slightly different. Instantaneous data are plotted using a stepped curve, while accumulated data are plotted using straight lines between the samples.
Error data
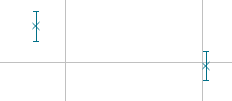
Any address may have associated error data. Those type of data will have the same address as their associated data, but are prefixed by ‘ER:’, ‘ERR:’ or ‘ERROR:’. Example: ‘ERR:FOPT’. It is not possible to select error data explicitly in the plot editor selection fields, but when selecting a vector having associated error data, the error data is plotted as error bars in the summary plot.
Example:
CSV Line Based Format
ResInsight supports a ’line based’ CSV file format variant as well. As opposed to the normal CSV format, data values are organized in lines. Each line must contain at least a date (and time), a vector address and a sample value. Optionally it may also contain an error value and a comment. The information carried by this format is equivalent to the normal CSV format, it is only a different file layout.
When importing a line based CSV file, no dialog appears. Instead a more stict set of rules apply to this type of files:
- At least DATE, VECTOR and VALUE columns must be present. The order of columns may be changed.
- Optionally the columns ERROR and COMMENTS may be present
- ISO date format must be used: ‘yyyy-mm-dd’ or ‘yyyy-mm-dd hh:mm’
- Semicolon (;) must be used as column separator
- Point (.) must be used as decimal separator
- The comment must not contain any semicolons
Example
The two examples below are equivalent and result in identical data after importing to ResInsight
Line based CSV:
Normal CSV:
Import RSM observed time history data
To import RSM files, the only action needed from the user is to select one or more RSM files. When the import is finished, one tree node for each file will appear under the Observed Data node in the project tree. RSM files can be either Column based or Keyword based.
Column Based File Format
If a column based file is presented, ResInsight first tries to identify if its header has fixed width or not. Further, the header is interpreted by looking for specific lines.
The first line must have one or more vector mnemonics. The initial letter(s) in a mnemonic specify which summary data type the column represents. For instance, FVPT and FWPT are of type Field, as they both have an initial F. WWCTH and WGORH are well data types.
The next lines can define units, well/group names, region names, LGR names and block numbers and the local cell number. They do not have to appear in any particular order. Scale factors can also be included, but will be ignored by ResInsight. All lines starting with – will also be ignored.
Column Based with Fixed Header Width
When interpreting column based files with fixed header width, ResInsight looks for left aligned column entries. These type of files are interpreted as we naturally read them. More than one table can be present in each file.
Column Based with Random Header Width
Column Based with Random Header Width will try to be parsed in the same way as fixed width, but it might fail in situations like the one below. We can see that SM3/SM3 probably belongs to WGORH, but it is parsed to WWCTH, as it is the second entry on that line.
Keyword Based File Format
If the non-comment line includes the word “VECTOR”, the file is interpreted as a keyword based file. In keyword based files, the content of the one-column tables is described in each header. Tables should be associated with a table containing time stamps. In the example below, S-1AH-GOR is associated with YEARX, since their origin is equal. ResInsight always interpret ORIGIN as well name, and look for a table with the line “VECTOR YEARX” to associate with it.