Paste Excel Time History Data
When text have been copied to the operating system’s clipboard, it will be possible to paste that text into a summary plot. Right click on a summary plot in the Plot Main Window Project Tree and select Paste Excel Data to Summary Plot. Then a paste options dialog will appear.
Paste Options Dialog
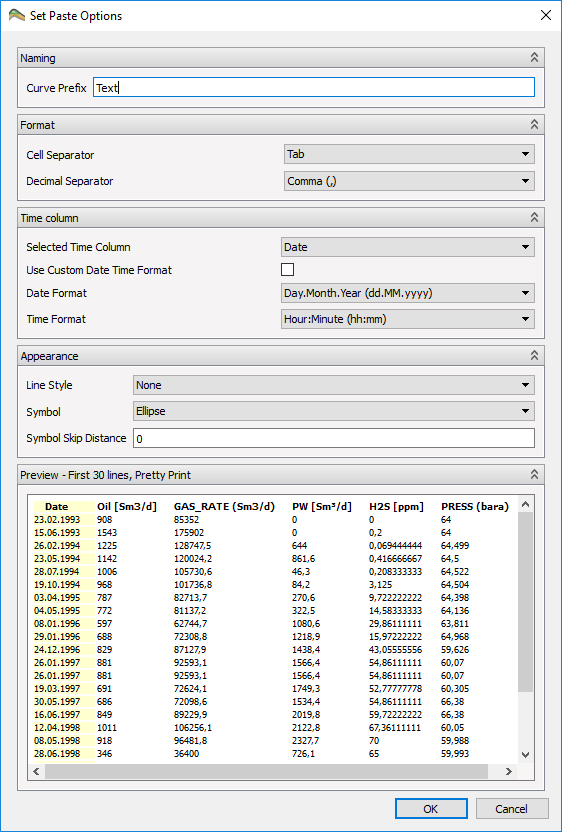
Most of the fields in this dialog are the same as in the CSV/txt import options dialog. Please see that section for documentation on those fields. The fields specific to the paste options dialog are as follows:
- Curve Prefix – Curve name prefix for all curves created from the pasted data.
- Line Style – Line style to use for the curves created from the pasted data.
- Symbol – Line symbol to use for each data point on the curves created from the pasted data.
- Symbol Skip Distance – Minimum distance between two adjacent symbols on the curves. If two data points on a curve is closer than the specified distance, a symbol is not drawn for one of the data points. Default value is 0, which will draw a symbol at all data points on the curves regardless of the distance between data points.