Preferences
In this section the different settings that controls the default behavior of ResInsight is described. These settings can be controlled using the Preferences dialog available from the Edit -> Preferences menu. Preferences are not stored in project files, but in a platform specific way for each user. Essential preferences are listed below.
General
When changing the preferences, any default color, font or Z-scale Factor that has not been changed by the user in the various views, will be applied immediately. If the user has changed font sizes in specific plots or annotations from the default value, ResInsight will ask if the user wants the new defaults applied to all existing views and plots even where custom settings have been set.
-
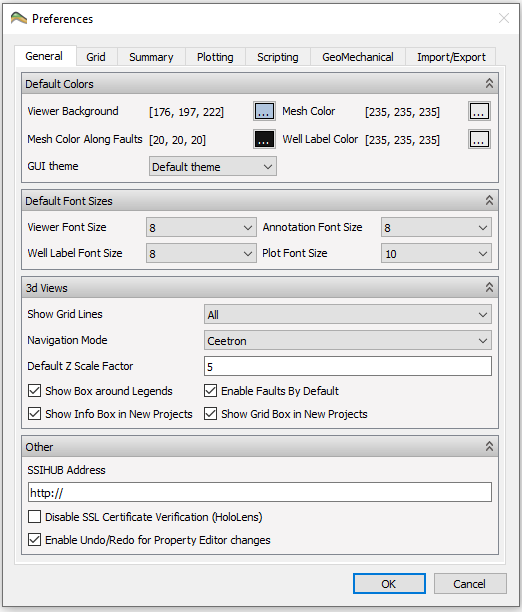
Default Colors: This group contains the colors that will be applied to the 3D views:
- Viewer Background
- Mesh Color
- Mesh Color Along Faults
- Well Label Color
-
Default Font Sizes: This group contains fonts preferences when using ResInsight:
- Viewer Font Size – The fonts used for axes labels, legends and info boxes in the 3d View.
- Annotation Font Size – The font used as default for Text Annotations.
- Well Label Font Size – The font used for all Well Path labels.
- Plot Font Size - The font used for plot legends, axes, and labels.
-
3D Views: This group of options controls visual settings to be used when creating new views:
- Show Grid Lines – Controls whether to show the grid lines by default for all cells or just along faults.
- Navigation mode – Defines the use of mouse for interaction with 3D model, c.f. Model Navigation.
- Default Z Scale Factor – Default depth scale for grid models.
- Show Box around Legends – Create a semi-transparent box containing each legend in the 3D Views.
- Enable Faults by Default – Controls default visibility of faults in views
- Show Info Box in New Projects – Controls default visibility Info Box in upper right corner
- Show Grid Box in New Projects – Controls default visibility of grid box
Grid
-
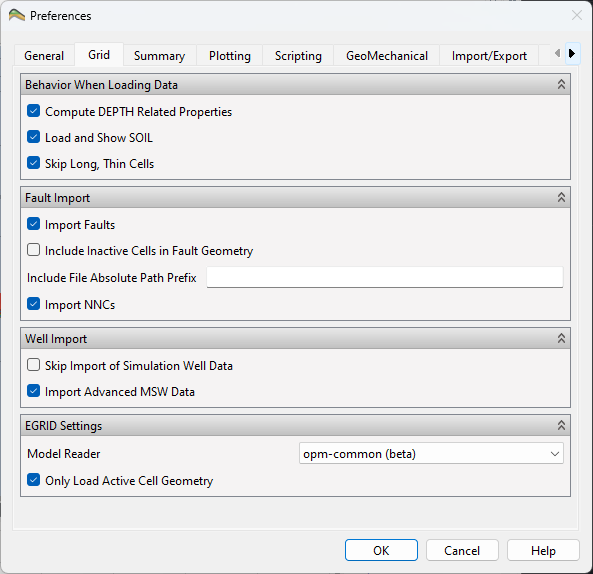
Behaviour When Loading Data
- Compute DEPTH Related Properties – If not present, compute DEPTH, DX, DY, DZ, TOP, BOTTOM when loading new cases.
- Load and Show SOIL – Control if SOIL is loaded and applied to grid per default.
-
Fault Import
- Import Faults – Controls import of Faults.
- Include Inactive Cells in Fault Geometry – Controls display of inactive cells in Fault Geometry.
- Include File Absolute Path Prefix – Windows platform: Additional prefix used when searching for files on the file system. The prefix is used when searching for keywords like FAULTS and EQUIL.
-
Well Import
- Skip Import of Simulation Well Data – Disable import of simulation well data for reducing case import time.
- Import Advanced MSW Data
-
Model Reader
- Select between ResData and opm-common
Summary
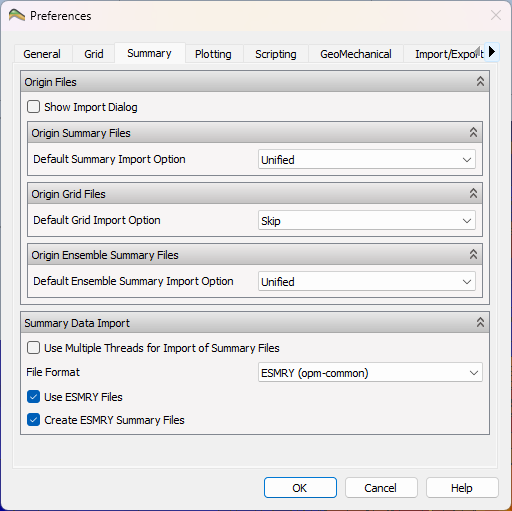
- Origin Files: c.f. Origin Files for details.
- Summary Data Import including file format for summary data import, c.f. Ensemble Summary:
- ESMRY (opm-common) Import data from ESMRY files
- UNSMRY (resdata) Import data from native UNSMRY files
- h5 (HDF5®) Import data from h5 files
Plotting
-
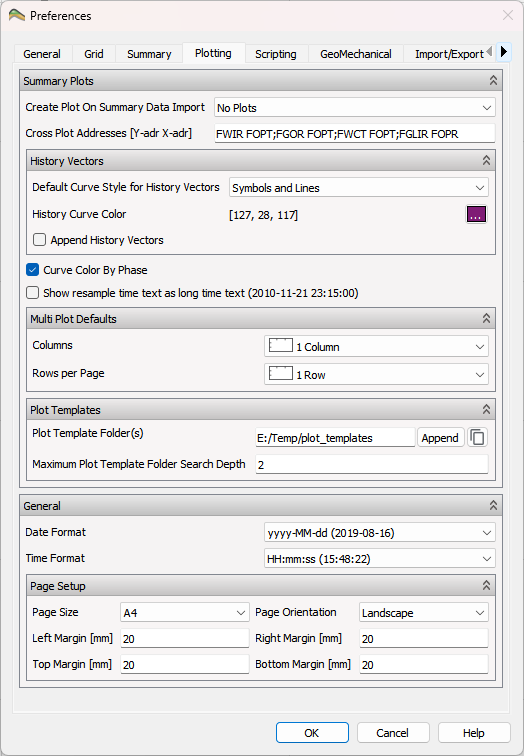
Summary Plots:
- Create Plot On Summary Data Import: governs automatic creation of summary plots when importing a summary case
- No Plots: do not automatically create summary plots
- Use Data Vector Names: Create summary plots automatically based on given vector names, e.g.
FOPT WOPT* - Use Plot Templates: Create summary plots automatically based on default templates.
- Cross Plot Addresses: List of vector pairs defining cross plot curves separated by semicolon. If a well or group is selected, the corresponding well or group address is displayed and used.
- Default Curve Style for History Vectors: allows specifying symbols and/or lines as preference.
- Append History Vectors: automatically include the corresponding history vector when appending a simulated summary vector.
- Curve Color By Phase: distinguish each phase by separate color.
- Create Plot On Summary Data Import: governs automatic creation of summary plots when importing a summary case
-
Multi Plot Defaults: specification of number of rows and columns for each page containing multiple summary plots.
-
Plot Templates: specification of folders and folder search depth for templates.
- Press Append to browse for folder to append.
- Specify Maximum Plot Template Folder Search Depth to restrict the depth of subdirectories to be searched for templates.
-
General
- Date and Time format preferences.
- Page Setup: Physical page size, orientation, and margins.
Note
Please consider the location and folders of your templates with care to cater for structured usage but also to limit the folder search depth for performance reasons.
Scripting
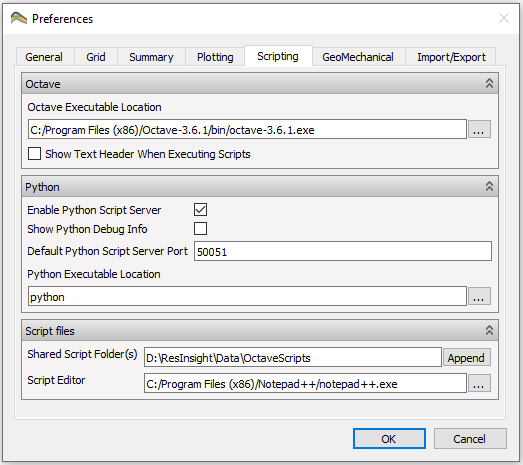
-
Octave c.f. Octave Interface for details:
- Octave Executable Location – Define binary file location for Octave, usually without path on Linux and including path on Windows.
- Show text header when executing scripts – Enables the default output from octave when started.
-
Python c.f. ResInsight Python API for details:
- Enable Python Script Server
- Show Python Debug Info
- Default Python Script Server Port
- Python Executable Location
-
Script Files:
- Shared Script Folder(s) – Defines the search paths for octave scripts
- Script Editor – The text editor to invoke when editing scripts
Import/Export
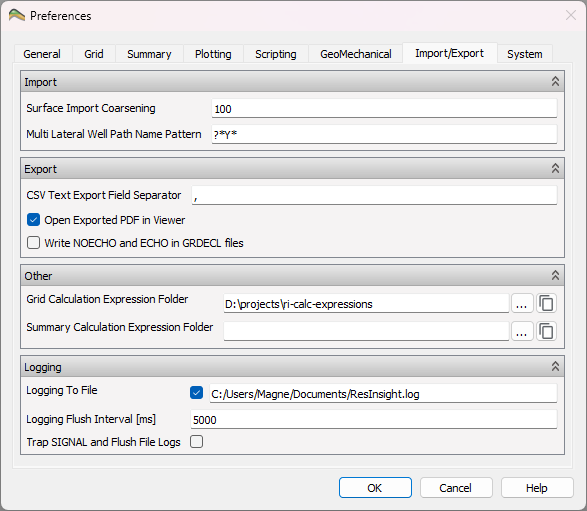
Cloud Services
An authorization token is created and stored in your home folder for access to cloud services. If you experience issues with the cloud service, the token can be deleted using a button. The standard authentication dialog will be displayed the next time you try to access the related cloud service.