Grid Cross Plots
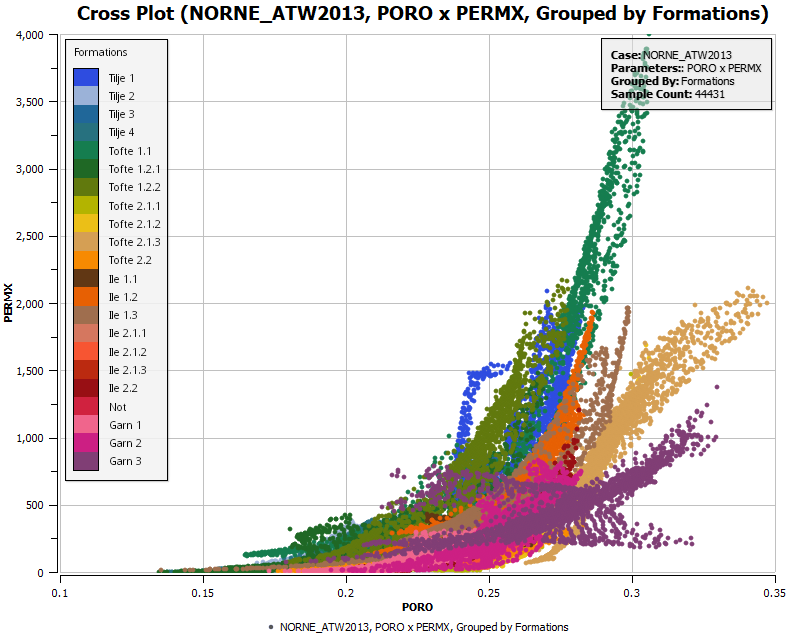
ResInsight supports the creation of scatter / cross plots of two reservoir simulation results against each other, with each cell in the grid representing one data point in the plot. The data points can be grouped by a third result, by time step or by Formations. giving a separate color and label for each group. The above example shows a classic Porosity vs Permeability plot, grouped by formations, showing different trends for each formation.
For continuous grouping parameters, the parameter will be divided into a set of equally sized intervals depending on the number of Color Legend intervals.
Each cross plot can contain any number of Data Sets, representing a collection of cross plot points, where the Data Set can have a case source, time step and cell filter associated with it. This way, dynamic parameters for different time steps can be compared, or results from different case realizations.
The Grid Cross plots may have a Symbol Legend below the plot, separating the Data Sets, and a Color Legend within the plot separating between the different Grouping categories or intervals. In addition, an Info Box will be added to the upper right corner of the plot, showing the different data sets in the plot and the parameters used. The Color Legends and Info Box can be moved to other parts of the plot and will snap to edges and corners when moved close to them.
Creating Grid Cross Plots
Grid Cross Plots can be created in a couple of ways:
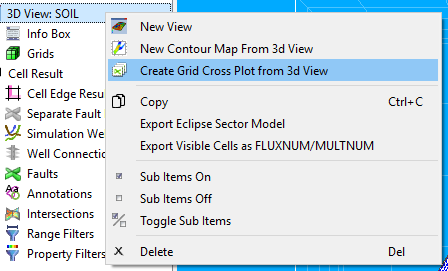
- Select a 3D view or Cell Result in the main ResInsight window, right-click and select Create Grid Cross Plot from 3d View. The resulting cross plot will display the current 3d Result x DEPTH and only contain data points for the visible cells.
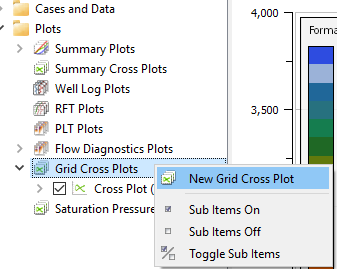
- Right-click on the Grid Cross Plots entry under Plots in the Plot Window. By default the plot will contain the result values PORO x PERMX and will be grouped by formations (if any are loaded in the project). Data for all active cells will be displayed.
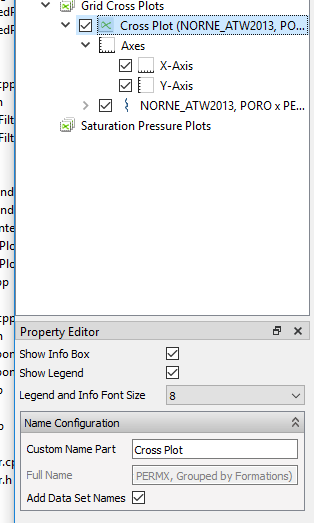
Having created a Grid Cross Plot, the appearance of the Legends, the Info box and the Plot Title can be set in the Property Editor of the Grid Cross Plot.
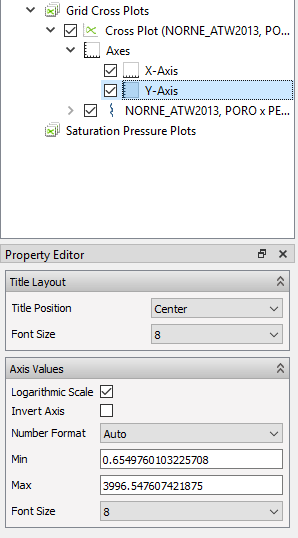
The plot also have some available settings for the two plot axes (X and Y), where the title position and font size can be altered plus the axis range may be controlled and the axis may be set as logarithmic and inverted so the smallest value is first (default for DEPTH on the Y-axis).
Regression Curves
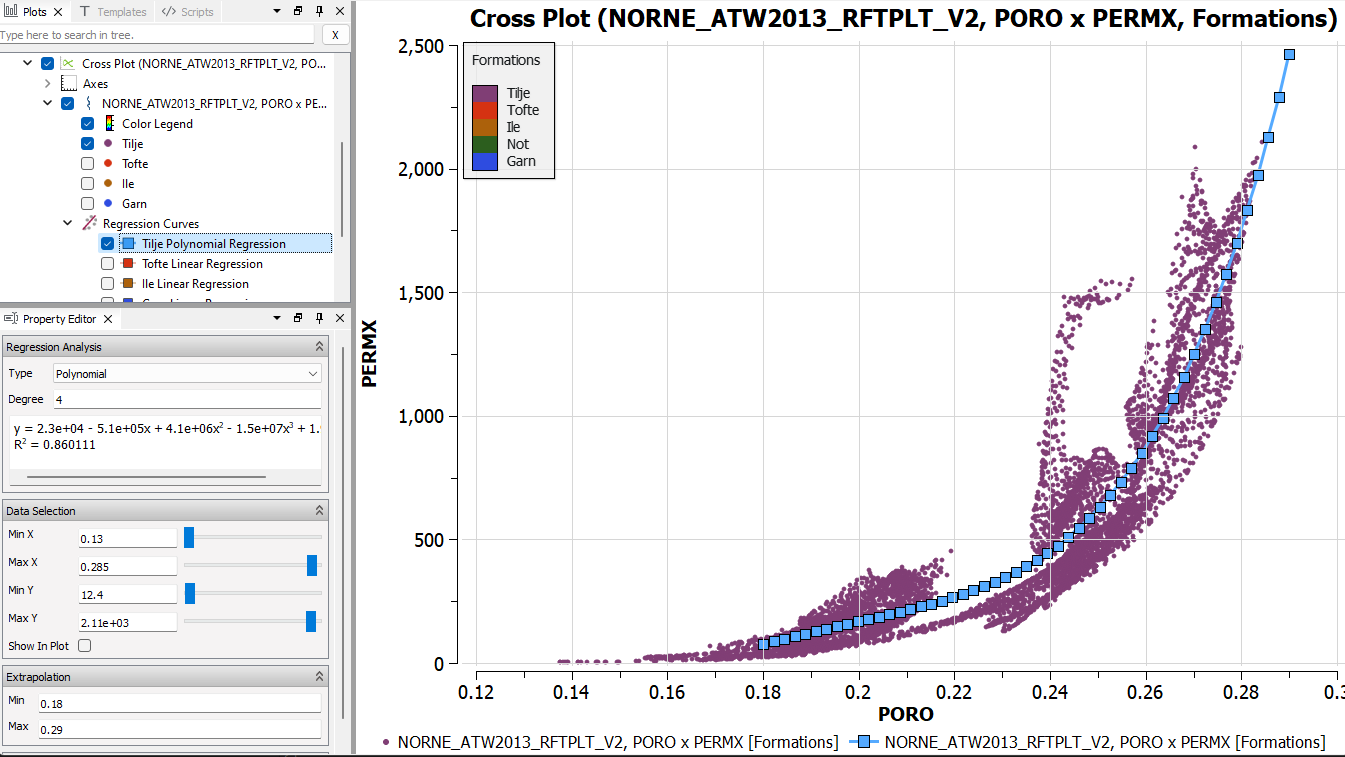 A regression curve can be displayed for each data group. The display of regression curves is controlled from the Regression Curves folder.
Grid Cross Plot Data Sets
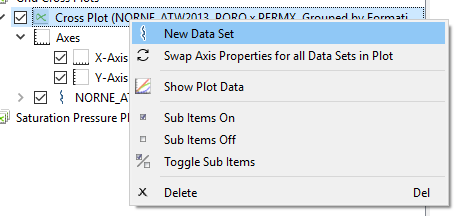
Further Grid Cross Plot data sets can be added to a Plot by right clicking on the plot in the Project Tree and selecting New Data Set.
The Data Sets contain all the parameters controlling the data source and types of data being plotted.
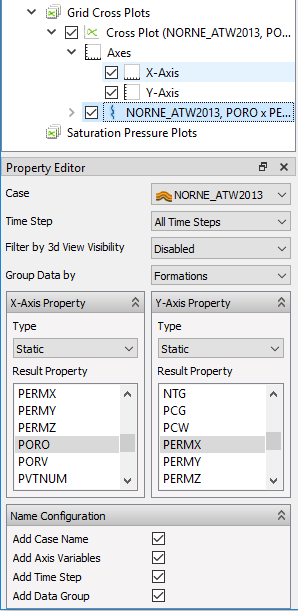
The available parameters are:
| Parameter | Description |
|---|---|
| Case | The reservoir simulation case containing the data |
| Time Step | Show data for All Time Steps or just a specific time step |
| Filter by 3d View Visibility | Pick a view to use only the cells visible in that view. Allows the use of range and property filters |
| Group Data by | Group and color data points by Time Step, Result Property or Formations |
| Data Grouping Property | Available if grouping by Result Property and lets you pick any Eclipse result property and the number of intervals to divide the data into |
| X-Axis Property | The property representing the X-axis in the cross plot |
| Y-Axis Property | The property representing the Y-axis in the cross plot |
| Name Configuration | Add Case Name, Axis Variables, Time Step and/or Data Group to the name of the Data set |
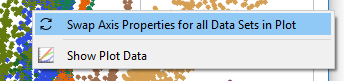
Show Plot Data
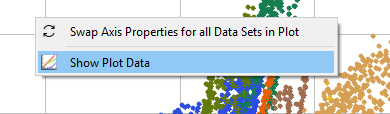
The data used to create the Cross Plot can be exported by either right-clicking on the Cross Plot in the project tree or right clicking on the plot itself and selecting Show Plot Data.
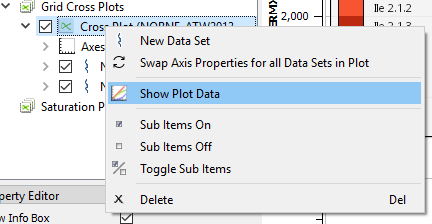
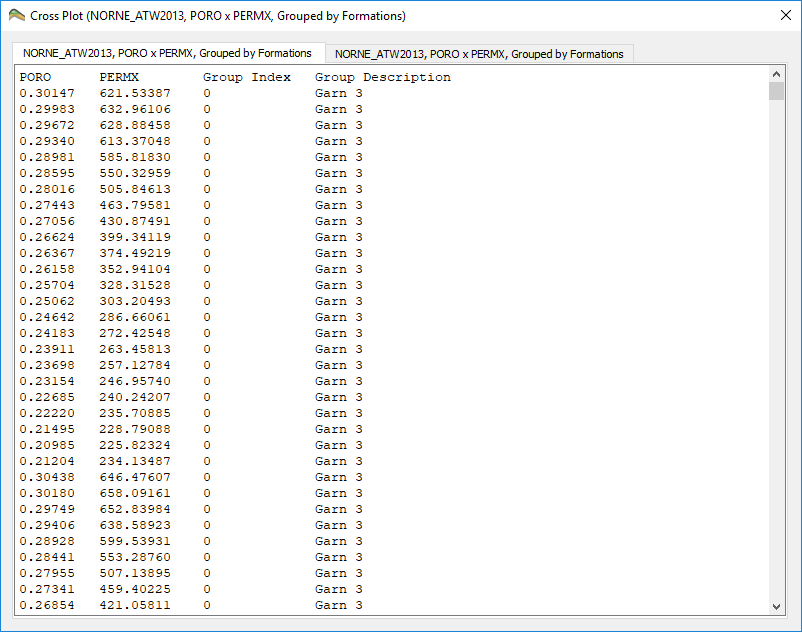
Either method will bring up a dialog containing column-based text showing the X and Y result values, the Group index and Group Description (the latter two if Grouping is enabled). One tab in the dialog will be added for each Data Set. The data can be copied to the clipboard or exported to file by right-clicking on the text area.
Swap Axes
The X- and Y-axes can be swapped, both for individual data sets, by choosing Swap Axis Properties from the right-click menu of the Grid Cross Plot Data Set, or for all data sets by right clicking on either the Cross Plot in the Project Tree or on the plot itself and selecting Swap Axis Properties for all Data Sets in Plot. The X- and Y-axis will swap place retaining the properties, such as Logarithmic or inverted axes.