Objective Functions
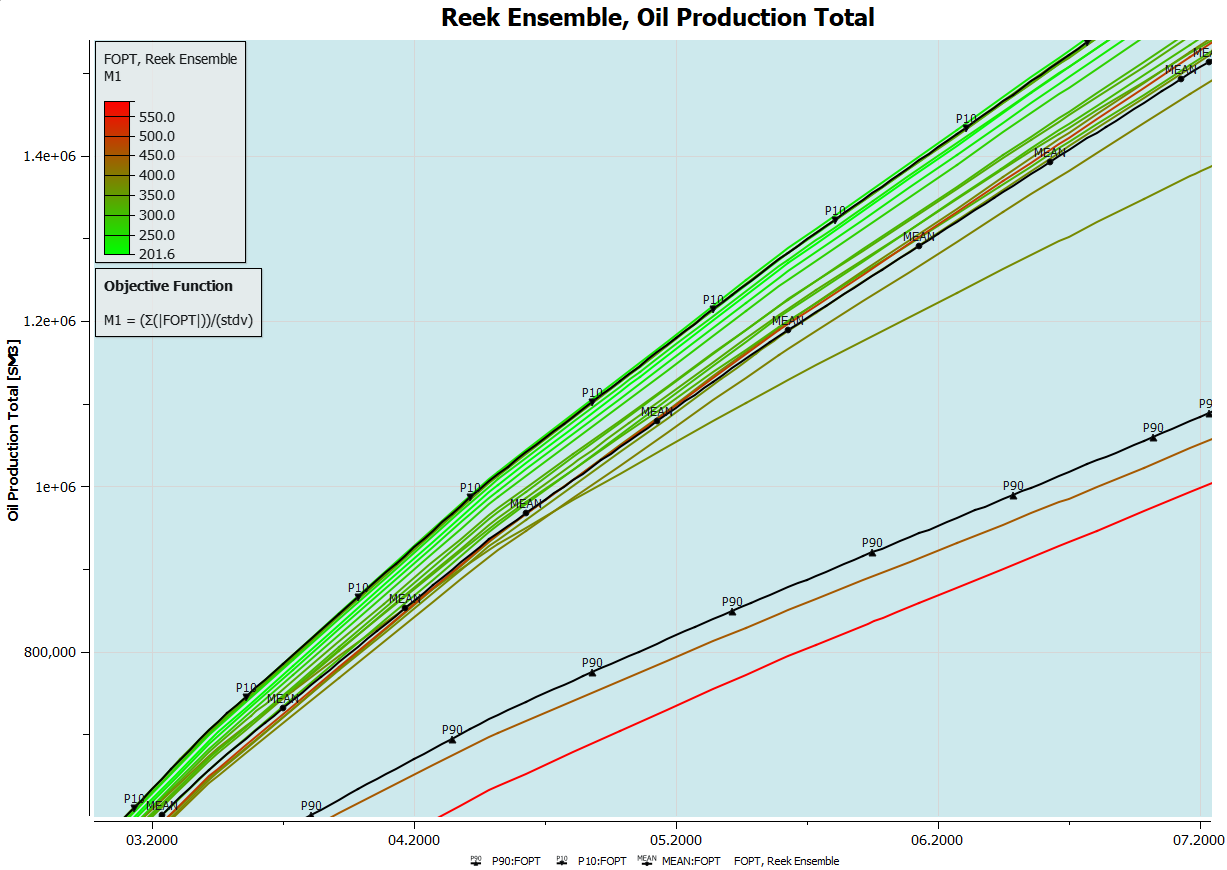
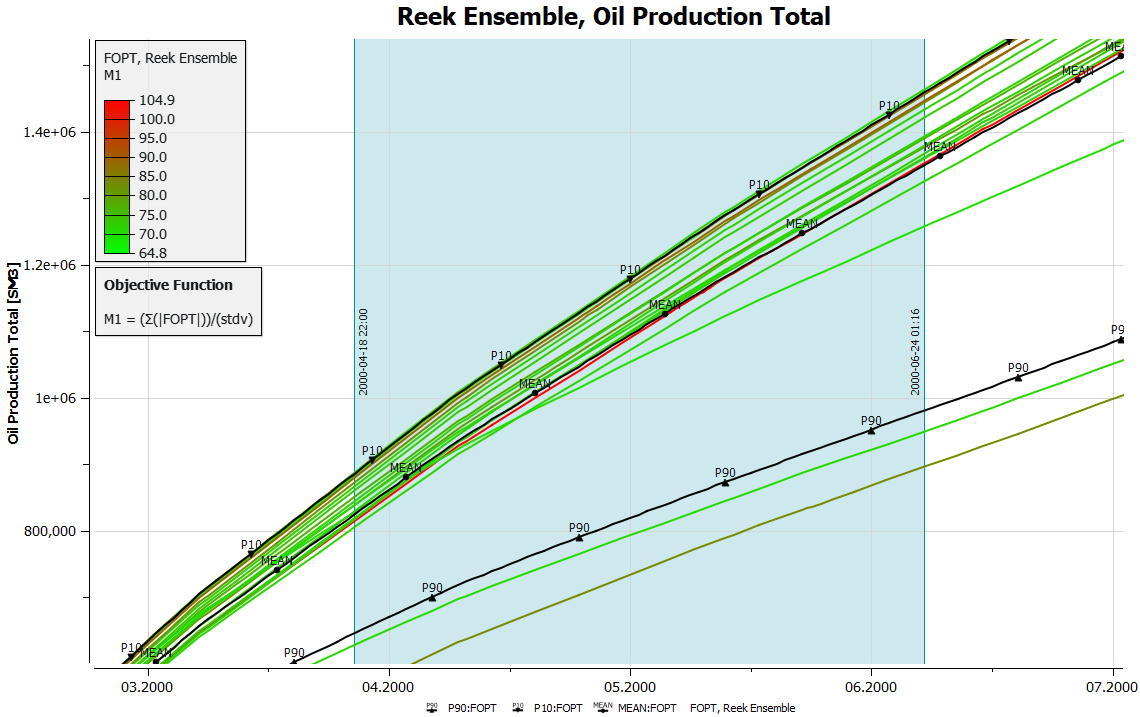
An Objective Function is used to color the curves of an ensemble plot in ResInsight to highlight characteristics by a function definition based on individual summary vectors. As shown in the example above, the legend relates colours to values as calculated by a particular objective function and shows the use and formula of the objective function in the plot.
Using Objective Functions
Curve coloring by Objective Function is activated as shown below.
Objective Function
ResInsight uses the following objective function definition:
$ F = \frac {1} {N} \Sigma (\frac{ \mid (t_i - tH_i) \mid }{ \epsilon * tH_i } )^n $
$ t_i $ : Simulated value for time step $i$
$ tH_i $ : History (observed) value for time step $i$
$ N $ : Number of Observations
$ \epsilon $ : Error estimate [0..100 %]
$ n $ : Either 1 - Basic error term, or 2 - Squared error term
The time step selection is either specified using Time Range (F1) to define all time steps in a time range or Selected Time Steps (F2)
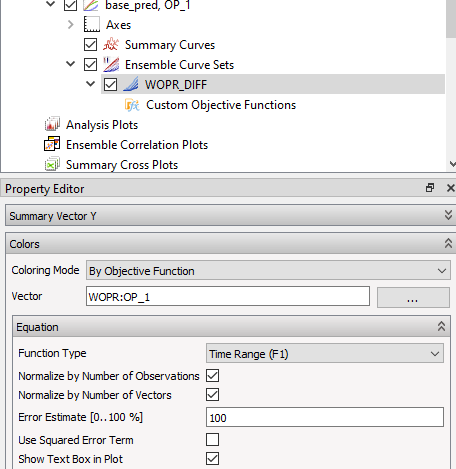
Creating Custom Objective Functions
It is also possible to create a Custom Objective Function to customize the coloring of ensemble plots:
-
Custom objective functions can express a weighted sum of the default objective functions (applied to any vector)
-
Custom objective functions allow for an arbitrary combination of weigthed default objective functions
-
Thus, $ M_{custom} = \Sigma_i^N weight_i * f_i(vectors) $ where $ f_i \in \lbrace F1, F2 \rbrace $
A Custom Objective Function is created by invoking the context menu on the Custom Objective Functions item in Plot Project Tree.
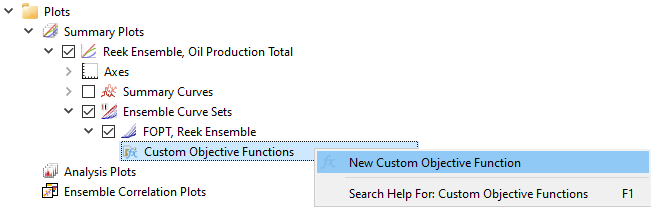
Adding a new weighted function expression to an existing objective function is performed by invoking the context menu as shown below.

Display settings
Changing objective function can be performed by the property editor of actual ensemble. The property editor also allows toggling the display of formula by the Show Formula in Plot check-box and setting of time step range.
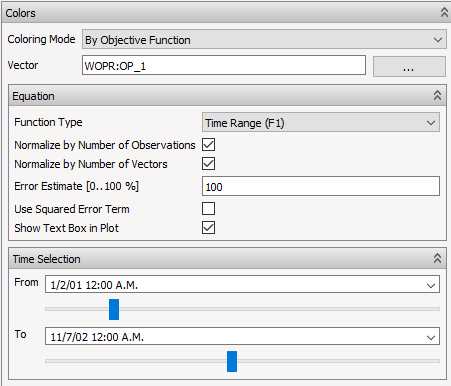
As seen below, selected range is displayed by color frame and labels in plot background. The range determines the time range for which the objective function is utilized for coloring the curves.