Summary Cross Plot
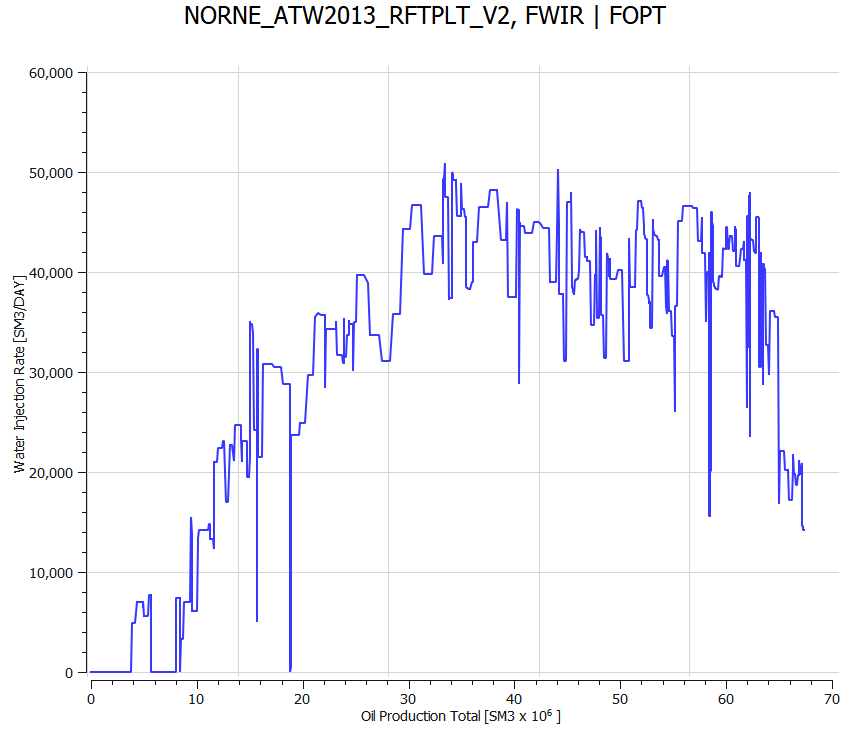
A Summary Cross Plot is a window displaying a graph in the main area of the Plot Main Window. It is very similar to an ordinary Summary Plot, but the x-axis displays summary vector values instead of time. Regression analysis is supported on single cross plot curves and ensemble statistics curves.
Summary Cross Plot Curves
New cross plot curves are created by using the right-click command
 New Summary Cross Plot Curve on a summary plot.
Cross plot curves can also be created from the right-click menu in the Summary Data Sources.

The combination of cross plot curves are defined in Plotting Preferences. Select the cross plot curve object to modify the properties for the curve. Make sure that the Axis Type is set to Summary Vector.
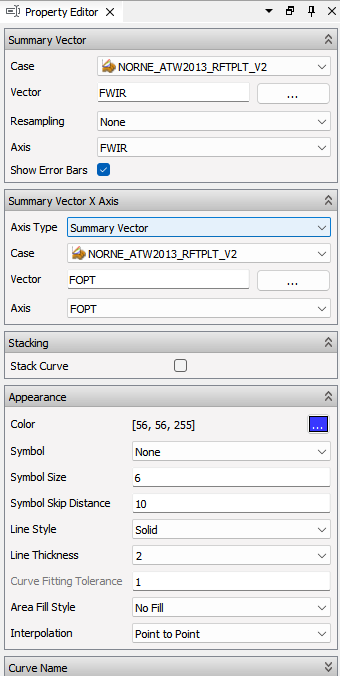
In this property editor, there is an additional group called Summary Vector X Axis. Like the other property editor groups, the vector selection groups works the same way as in the ordinary summary plot.
See the detailed description.
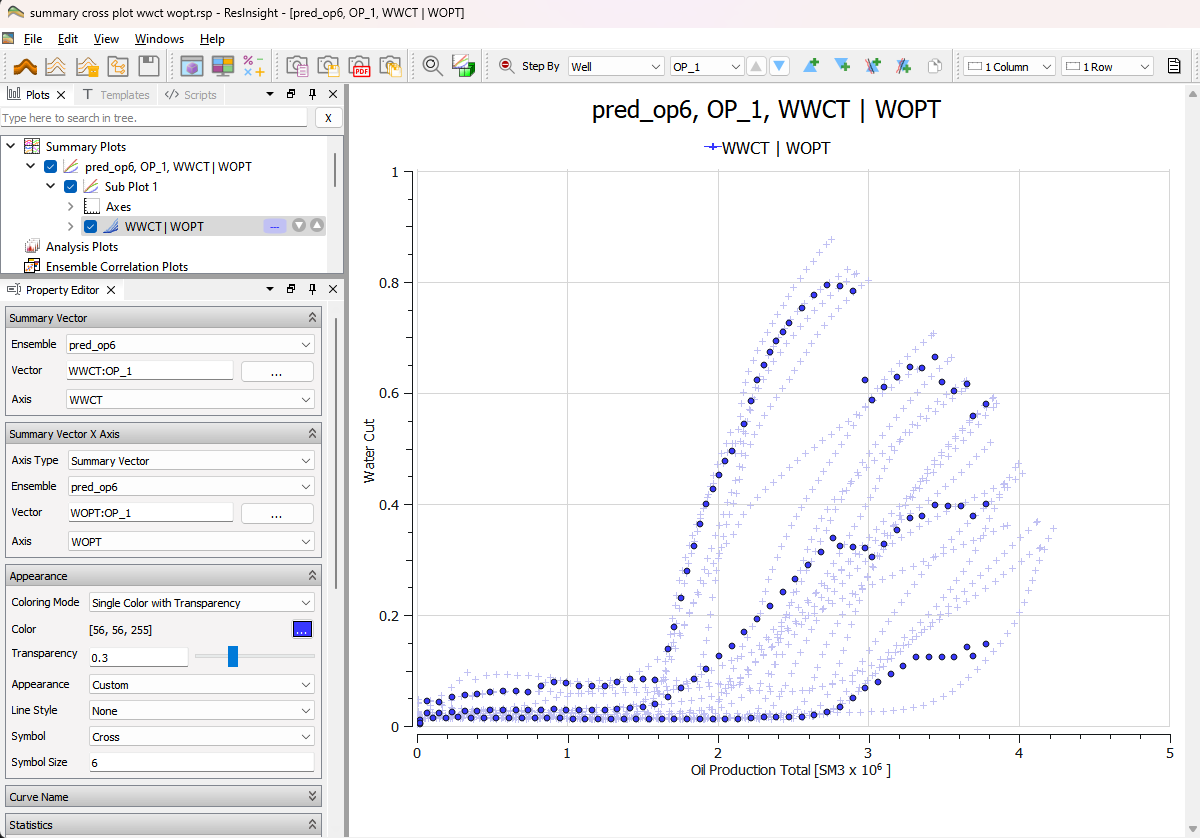
Summary Cross Plot Ensemble
When computing statistics curves for the ensemble, the x-axis is divided into bins. For each bin, all values are collected. A minimum realization count is used descide if there are enough realizations to compute statistics. The number of bins and realization count threshold can be set in the Property Editor for the ensemble.
When creating cross plots based on ensembles, the appearance of curves can be adjusted in the property editor. Note that the appearance of statistics curves also can be customized in the Statistics group. Regression analysis is supported on ensemble statistics curves.
Cross Plotting
A cross plot is established based on two input summary vectors. Each entry in the cross plot consists of one vector item value from each of the two input vectors having equal time steps. However, in most cases the two input vectors do not share the same time steps. To be able to create a cross plot in such cases, linear interpolation between adjacent input vector items is being used.
When a current time step T in input vector A is not found in input vector B, ResInsight interpolates between the time steps before and after T in vector B. In this way, ResInsight calculates an interpolated value for time step T from vector B. The same happens when a time step in vector B is not found in vector A.
If either the value at the current time step or one of the values involved in interpolation are NULL, the resulting vector will have a NULL value at the current time step. This is displayed as a ‘hole’ in the cross plot curve.