Memory Management
ResInsight can require a considerable amount of memory to hold all the grids and necessary result variables. If the requirements starts approaching the available physical memory on the workstation, ResInsight may become unstable and crash, as the operating system starts freeing memory to avoid system failure. To help alleviate this, ResInsight has some built-in memory management tools.
Memory Indicator
The tools are available from the memory indicator in the bottom right corner of the main 3D window.
If the available physical memory dips below 5% of the total physical memory on Windows, a warning will be displayed in the memory indicator. This threshold is 17.5% on Linux, as the memory manager on Linux is more likely to start stopping processes when memory is low. The amount of memory used will also be displayed in progress bars during operations in ResInsight if the available memory is less than 50% of total physical memory. In any case, ResInsight is likely to be stopped without warning by the operating system if the amount of used memory starts approaching the total physical memory on the computer.
Memory Management Tool
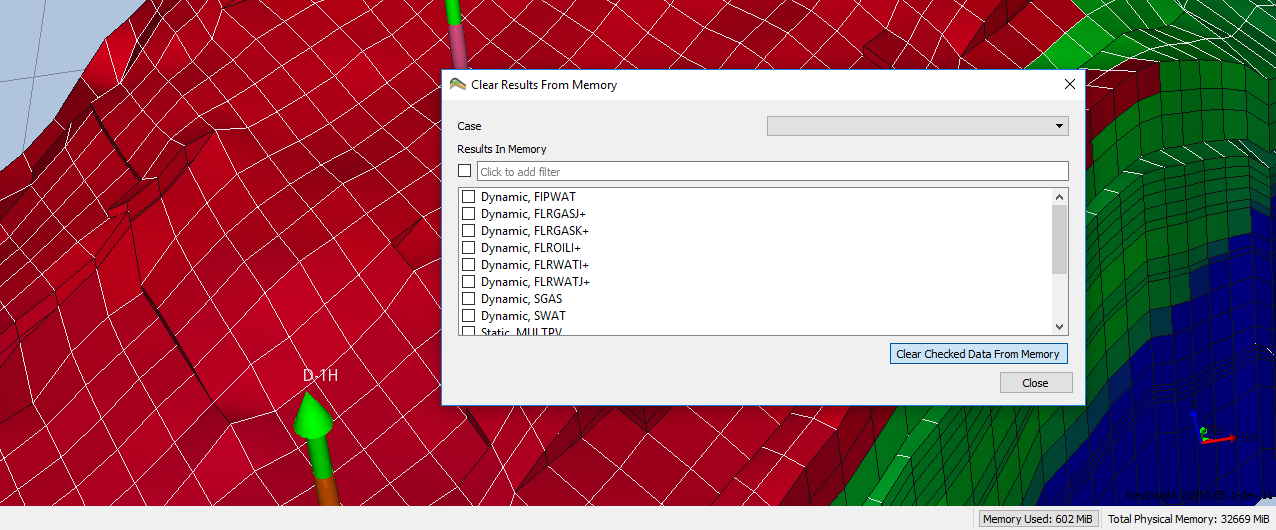
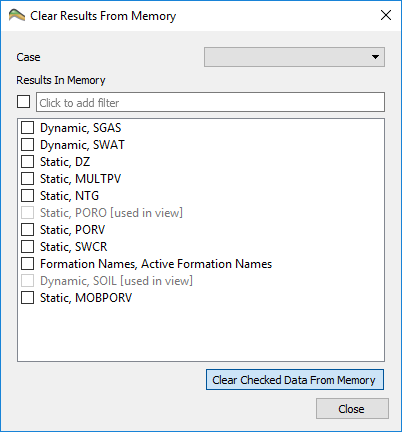
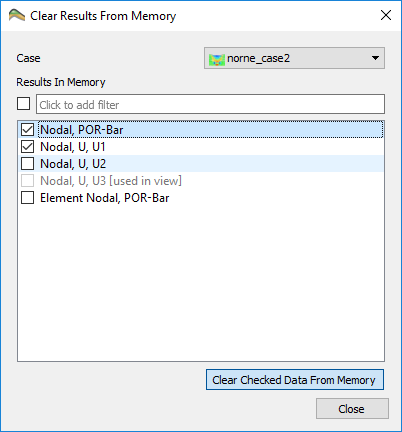
It is possible to click on the memory used indicator to open up a dialog allowing the user to clear results from memory when they are no longer required. Any tool that is not currently used in a view may be cleared by selecting the result and clicking the Clear Checked Data From Memory. Note that, depending on your operating system, this may not result in a reduction in the memory reserved by the application. However, the actual use will have gone down and it may now be possible to run more operations without running out of memory.
Detailed usage of memory can be seen by clicking Show Memory Report.
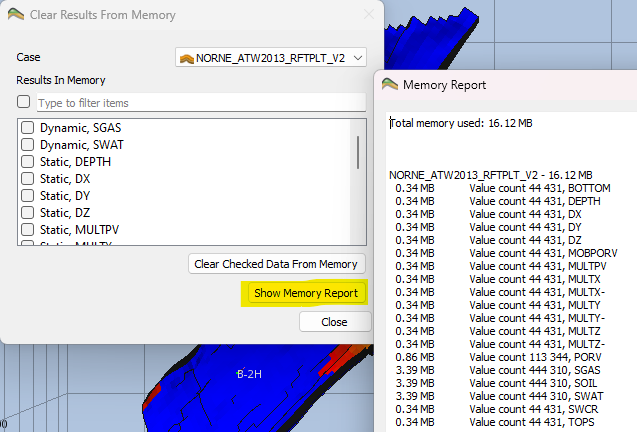

By default, results will be shown for the active case. However, a specific case may be selected in the top drop down list. The pictures below show the dialog for both Eclipse and Abaqus results.
