Correlation Plots
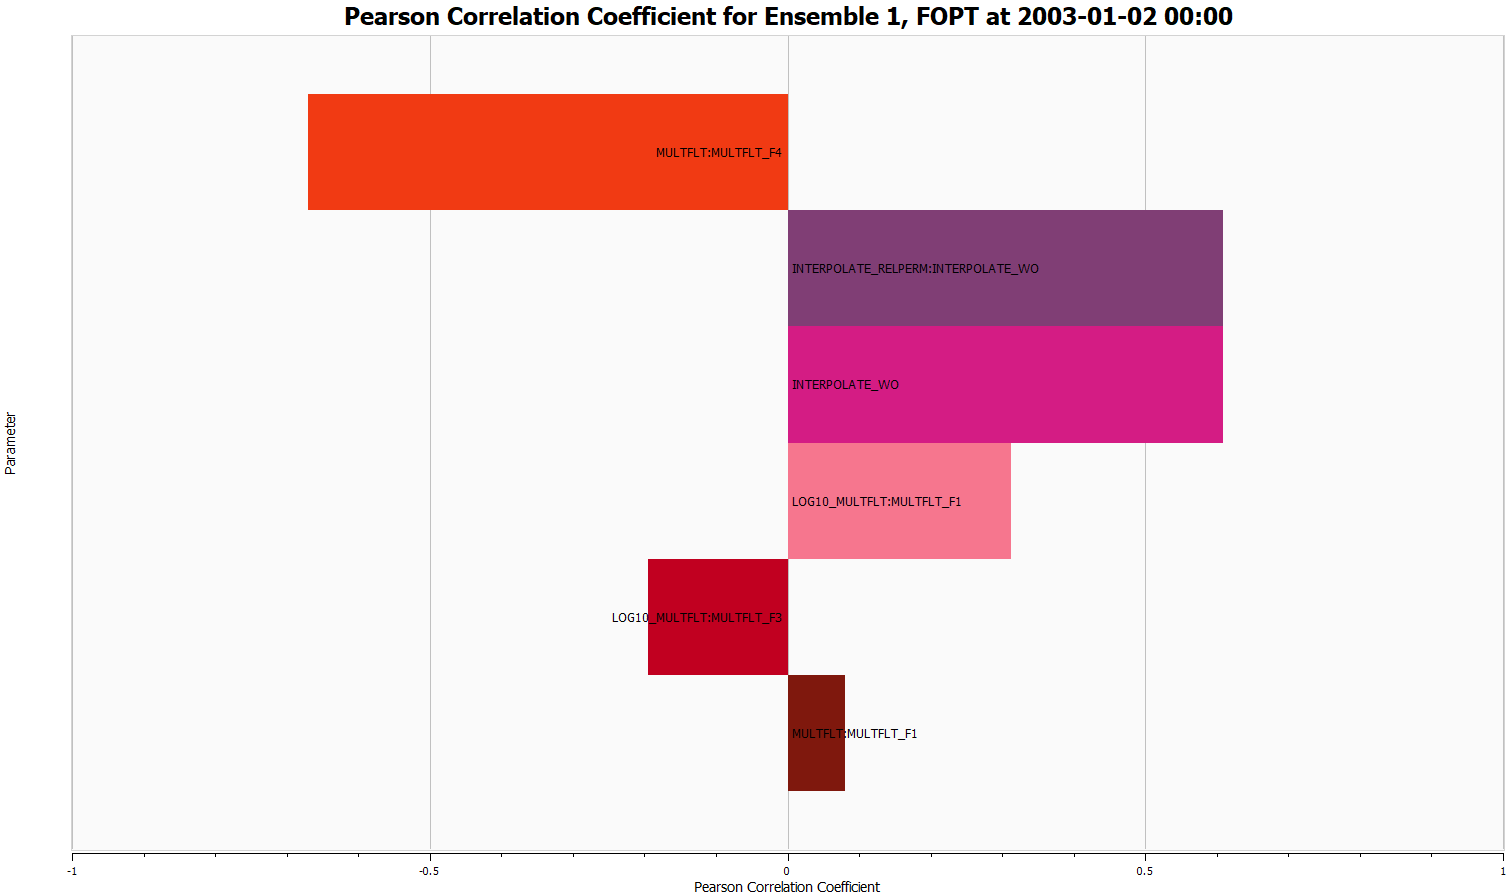
Correlation Plots are plots used to visualize correlations between ensemble parameters and summary result vectors. Several visualizations can be created, including tornado plots, correlation matrices, and cross plots.
Creating a Correlation Plot
The most convenient way to create a Correlation Plot at a given time step is often to right-click an Ensemble Plot and invoke the submenu shown below.
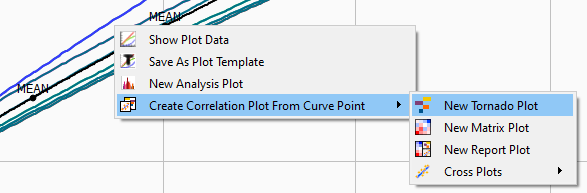
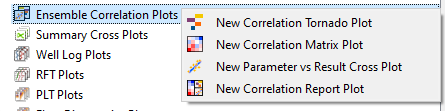
Alternatively, Correlation Plots can be created by right-clicking the Correlation Plots item in Plot Project Tree.
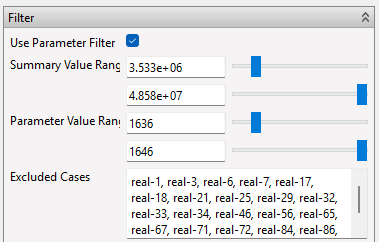
Cross Plot Filter
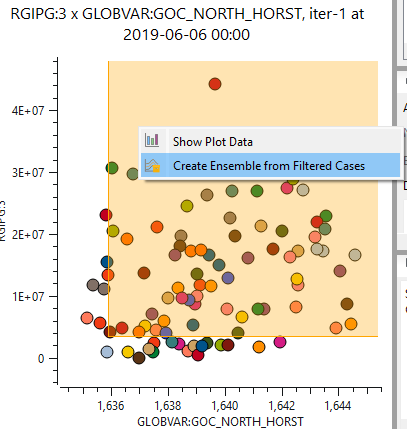
The realizations are displayed in a cross plot with result parameter vs summary value. A filter on x and y axis can be set. The realization matching the filter can be used to create a new ensemble. This option is available on the right-click menu of a correlation plot.
A new ensemble can be created based on the filtered cases in the right-click menu of the cross plot. A histogram of the ensemble parameter can also be created.
Specifying Setup and Settings
The Correlation Plots property editor allows the user to specify an extensive number of settings dependent on the actual type of correlation plot. The complete set of settings are listed below according to the individual sections of the property editor.
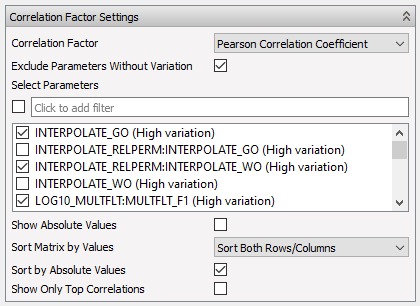
Correlation Factor Settings
This section of the property editor allows for setting correlation factor to either Pearson Correlation Coefficient or Spearman’s Rank Correlation Coefficient as basis for Correlation Plots and to select ensemble parameter(s) of choice. Being irrelevant, please note that the section will not display for Correlation Cross Plots and that the field Sort Matrix by Values will not display for tornado plots.
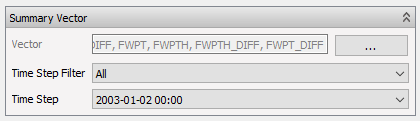
Summary Vector Settings
This section of the property editor allows for setting summary vector(s) and time step. To ease the selection of time step, the Time Step Filter may be used to skip time steps by years, quarters, months, weeks, or days.
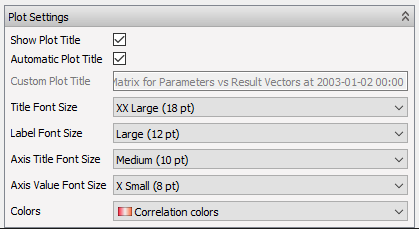
Plot Settings
This section of the property editor allows for setting plot title, font sizes, and legend if relevant. Please note that the Colors setting for specifying legend is irrelevant to tornado plots and cross plots and will not display for these types of Correlation Plots.
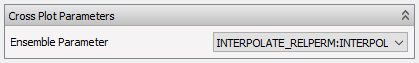
Cross Plot Parameter Setting
This section of the property editor will only display for cross plots to allow specification of ensemble parameter to cross plot with summary vector(s).