PLT Plot
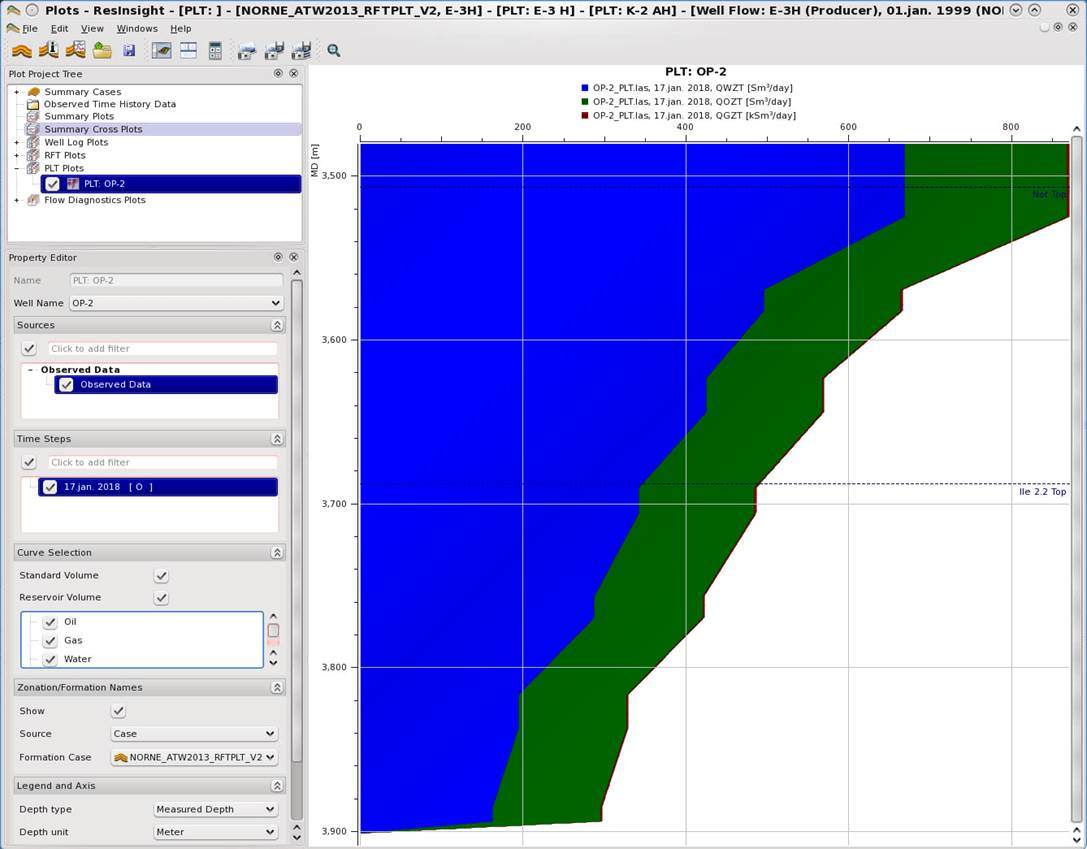
A PLT (Production Log Tool) plot is a special well plot for comparing observed production (well flow rates) and simulated production. The curves are plotted as production against measured depth (MD). Simulated production data is retrieved directly from the grid model or from the corresponding (*.rft) files, while observed production data are loaded from well log files (*.las).
Create New PLT Plot
There are several ways to create new PLT Plots
From Project Tree in the Plot Main Window
- Select right-click command New PLT Plot for the PLT Plots node.
From the Project Tree in the Main Window
- Select right-click command New PLT Plot for a Well Path node or a Simulation Well node that has an associated well path.
From the 3D view
- Right-click a well path, or a simulation well that has an associated well path, and select Well Plots -> New PLT Plot.
Plot Observed Data
To be able to plot observed production data for a well, a well log file containing that data must be imported. Production data in a well log file is expected to have column names:
| Component | Names |
|---|---|
| Oil | QOZT, QOIL, xxxx_QOIL |
| Gas | QOZT, QGAS, xxxx_QGAS |
| Water | QGZT, QWAT, xxxx_QWAT |
| Total | QTZT, QTOT, xxxx_QTOT |
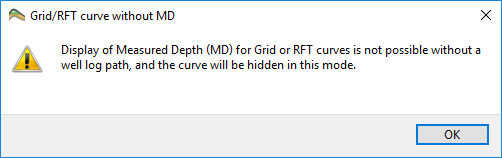
To be able to plot simulated data for a well, the trajectory for that well have to be imported. If no well trajectory is found, ResInsight will present a warning dialog to the user.
Property Editor
The property editor lets the user select which curves to display in the PLT plot.
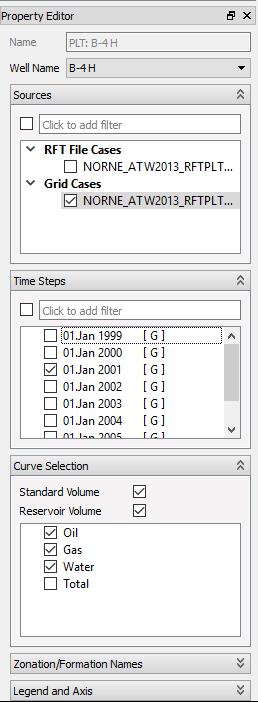
Well Name
Select the well to display in the plot. Only observed well paths are displayed.
Sources
After a well has been selected in the Well Name field, sources for that well should appear in the sources field. The sources are placed in one of three different groups:
- RFT File Cases – Simulation cases may have associated PLT data in *.rft file(s). If the simulation case contains such files, those are imported together with the simulation case (See the keyword
WRFTPLTfor details) - Grid Cases – Simulation cases
- Observed Cases – Observed data imported from well log files and well path files
When the user selects a source, time steps for that source appears in the Time Steps field.
Time Steps
The Time Steps field contains available time steps for the selected source(s). Some combinations of selected sources may display a filtered list of time steps instead of the union of all time steps for all selected sources. The policy is as follows:
- Exclusively grid cases selected. All available time steps for the selected grid cases are displayed.
- Grid case(s) and observed data case selected. Time steps shown are:
- The first time step from the merged time step list from all grid cases.
- If no time steps from grid cases match the observed time step, display the two adjacent grid case time steps.
- Grid case(s) and RFT File case(s) selected. Same display logic as point 2.
- All types of cases selected. Same display logic as point 2 with the exception that RFT File case time steps are treated as grid time steps.
Each time step is postfixed by an indication of which source type(s) the time step is belonging to. This indication is displayed as one or more letters within square brackets. Examples: [ O ], [ R G ].
- O – Time step belongs to observed data
- R – Time step belongs to RFT data
- G – Time step belongs to Grid data
More than one letter for one single time step, means that the time step belongs to multiple case types.
Curve Selection
The curve selection group lets the user control which component(s) of the PLT data to display.
- Standard Volume – Production data at standard conditions (normal air pressure)
- Reservoir Volume – Production data at reservoir pressure (high air pressure)
- Oil – The oil production component
- Gas – The gas production component
- Water – The water production component
- Total – Total production
Zonation/Formation Names
This property editor lets the user control how formations are handled. This is what it looks like in the PLT plot context.
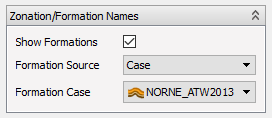
Please see the full documentation on the formations property editor for details.
Note
When the formation names property editor is used in the context of PLT plots, the fields Trajectory and Simulation Well are hidden because those values are given by the PLT plot definition.
Legend and Axis
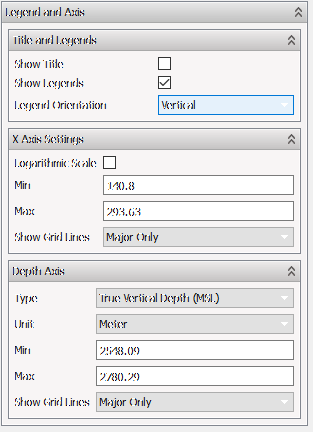
This property editor lets the user control visual properties for the legend and axis.
- Title and Legends
- Show Title – Toggle on/off title in plot
- Show Legends – Toggle on/off legend in plot
- Legend Orientation – Vertical or horizontal
- X Axis Settings
- Logarithmic Scale – Toggle between linear and logarithmic
- Min – Set X axis minimum value
- Max – Set X axis maximum value
- Show Grid Lines – Enable grid lines in background in plot
- Depth Axis
- Type – Toggle between True Vertical Depth (MSL) or Measured Depth (MD)
- Unit –
- Min – Set depth axis minimum value
- Max – Set depth axis maximum value
- Show Grid Lines – Enable grid lines in background in plot
Plot
The PLT plot displays groups of curves. A group consists of the components oil, gas and water. The curves within a group are stacked, the biggest component first.