Contour Maps
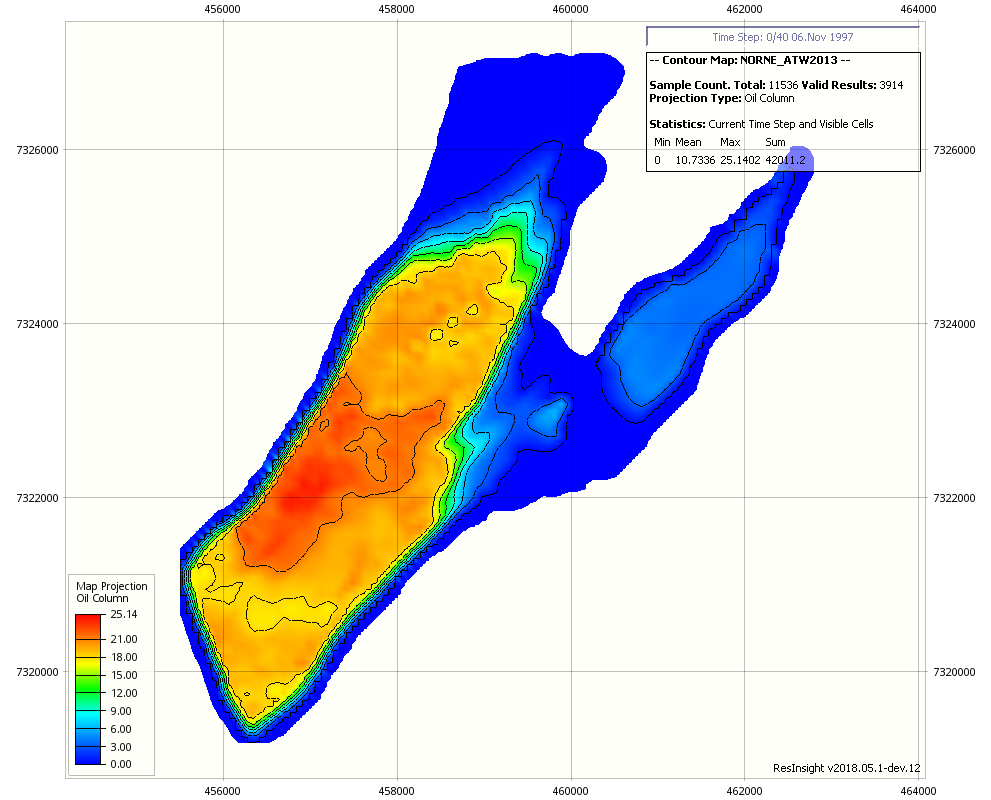
ResInsight can create contour maps based on different forms of aggregation of 3D reservoir simulation data onto a 2D Plane. Any 3D result value can be aggregated, in addition to specialised results, such as Oil, Gas and Hydrocarbon columns. A Contour Map is a specialised 2D view with many of the same features as the 3D views, including property filters, range filters and display of faults and wells. ResInsight is able to export a contour map to a text file.
Polygons can be created from visible areas. If you want to compute contour maps for ensembles, look at Ensemble Contour Map
Creating New Contour Maps
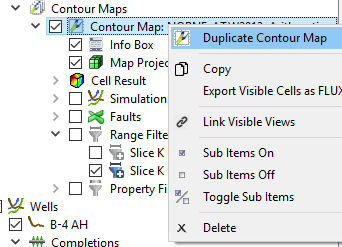
Contour Maps can be created in many different ways:
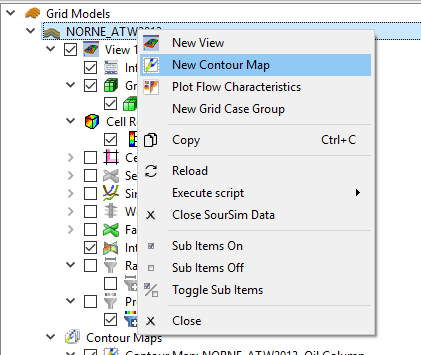
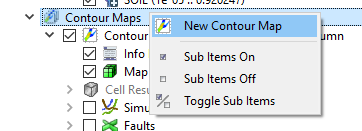
- New Contour Map from the right-click menu of case or the Contour Maps project tree item underneath the case. These will create contour maps with default values.
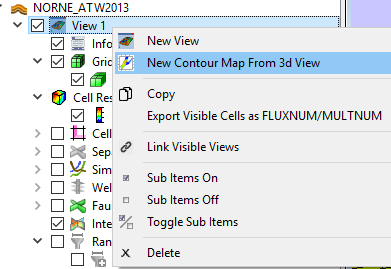
- New Contour Map from 3D View in the simulation View right-click menu. This will create a contour map based on the existing 3D View with matching filters and result.
- Duplicate Contour Map from the right-click menu of an existing Contour Map. This will copy the existing map.
Properties of the Contour Maps
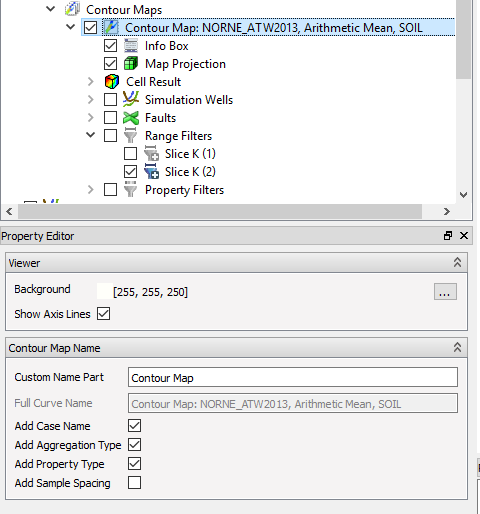
A contour Map has many of the same options available as a 3D View, but is always orthographic/parallel projection with no perspective projection or lighting available. Instead of the 3D Grid Box, the Contour Maps uses a 2D Grid similar to the 2d Intersection Views with optional Axis Lines controlled with the Show Axis Lines toggle. The name of the map can be automatically generated from the Case Name, Property Type, Aggregation Type and Sample Spacing (See Map Projection Properties for the two latter).
Map Projection Properties
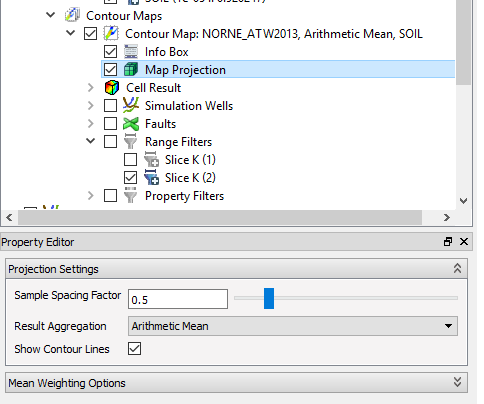
The Map Projection settings control how the 3D Data is aggregated onto the 2D plane. In all cases the results are calculated for a square 2D Cell lying in an arbitrary z-plane of the 3D Grid. For each 2D cell a cuboid extrusion in the full bounding extent of the 3D grid is created and this cuboid extrusion is used to calculate the volume of intersection with the 3D Grid cells for all volume weighted sums and averages. For the regular sums, a vertical ray through the center of the 2D cell is used instead. Since the ray may travel through multiple cells in the same K-layer, all the values from within one K-layer are averaged before being added to the sum.
A set of parameters governs this projection:
- Sample Resolution controls how many 2D Grid Cells are used in the map. Select finer resolution for more detailed maps. Note that finer resolution requires more processing power.
- Result Aggregation: Here the following options are available:
| Aggregation Type | Description |
|---|---|
| Oil Column | $\sum_{i=1}^{n} SOIL * NTG * PORO * dZ$ |
| Gas Column | $\sum_{i=1}^{n} SGAS * NTG * PORO * dZ$ |
| Hydrocarbon Column | $\sum_{i=1}^{n} (SGAS+SOIL) * NTG * PORO * dZ$ |
| Mobile Oil Column | $\sum_{i=1}^{n} (SOIL - SO?CR) * NTG * PORO * dZ$, where SO?CR is either SOWCR, SOGCR or a user defined constant |
| Mobile Gas Column | $\sum_{i=1}^{n} (SGAS - SGCR) * NTG * PORO * dZ$, where SGCR can be a user defined constant |
| Mobile Hydrocarbon Column | $\sum_{i=1}^{n} ((SOIL - SO?CR) + (SGAS - SGCR)) * NTG * PORO * dZ$, where options are described above |
| Arithmetic Mean | $A_w = \frac{1}{n} \sum_{i=1}^{n} w_i*x_i$, where the weight is 1.0 by default |
| Harmonic Mean | $H_w = \frac{\sum_{i=1}^{n} w_i}{\sum_{i=1}^{n} \frac{w_i}{x_i}}$, where the weight is 1.0 by default |
| Geometric Mean | $G_w = \left(\prod_{i=1}^{n} x_i^{w_i}\right)^{\frac{1}{\sum_{i=1}^{n} w_i}}$, where the weight is 1.0 by default |
| Volume Weighted Sum | $S = \sum_{i=1}^{n} w_i*x_i$, where the weight is 1.0 by default. Suitable for volume fractions such as SOIL or PORO |
| Sum | A sum of the specified cell result. Suitable for absolute quantities. |
| Top Value | The first value encountered downwards vertically |
| Min Value | The minimum cell result value in the volume underneath the 2D Element |
| Max Value | The maximum cell result value in the volume underneath the 2D Element |
For the Column options, no Cell Result is available in the property tree under the Contour Map.
Value Filtering
The resulting contour map values can be filtered by activating a value filter in the Property Editor. Either Above, Below or Between can be selected. This can be useful as a preprocessing step before creating polygons.
Weighting Means by Cell Result
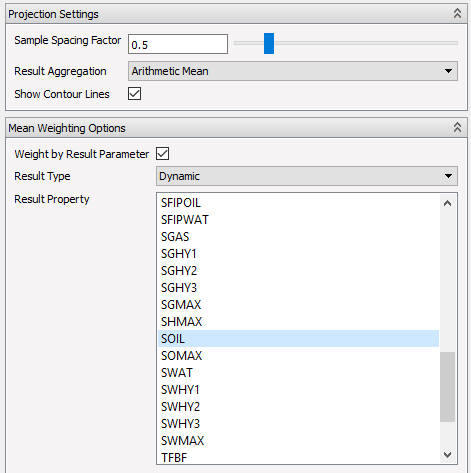
For the Arithmetic Mean, Geometric Mean and Harmonic Mean it is also possible to specify a cell result as a weighting parameter in addition to the regular weighting by volume of intersection. The total weight will then be the volume of intersection multiplied by the specified cell result. The full range of regular cell results is available for this use.
Difference options
Creating a Contour Map as a difference with a specific base case and/or base time step is performed by clicking the
 Cell Result item
underneath the actual Contour Map in the project tree. This will display the
Cell Result Property Editor to specify base case and/or base time step.
Cell Result item
underneath the actual Contour Map in the project tree. This will display the
Cell Result Property Editor to specify base case and/or base time step.
Polygons of Visible Areas
Polygons of visible contour map areas can be created from the “Create Polygons from Contour Map” in the right-click menu.
Contour Map Export
ResInsight is able to export a contour map to a text file.