RFT Correlation Plot
The RFT Correlation Plot combines an ensemble RFT plot with correlation analysis, making it possible to investigate how ensemble parameters relate to the RFT pressure response. The plot links three coordinated views in a single layout:
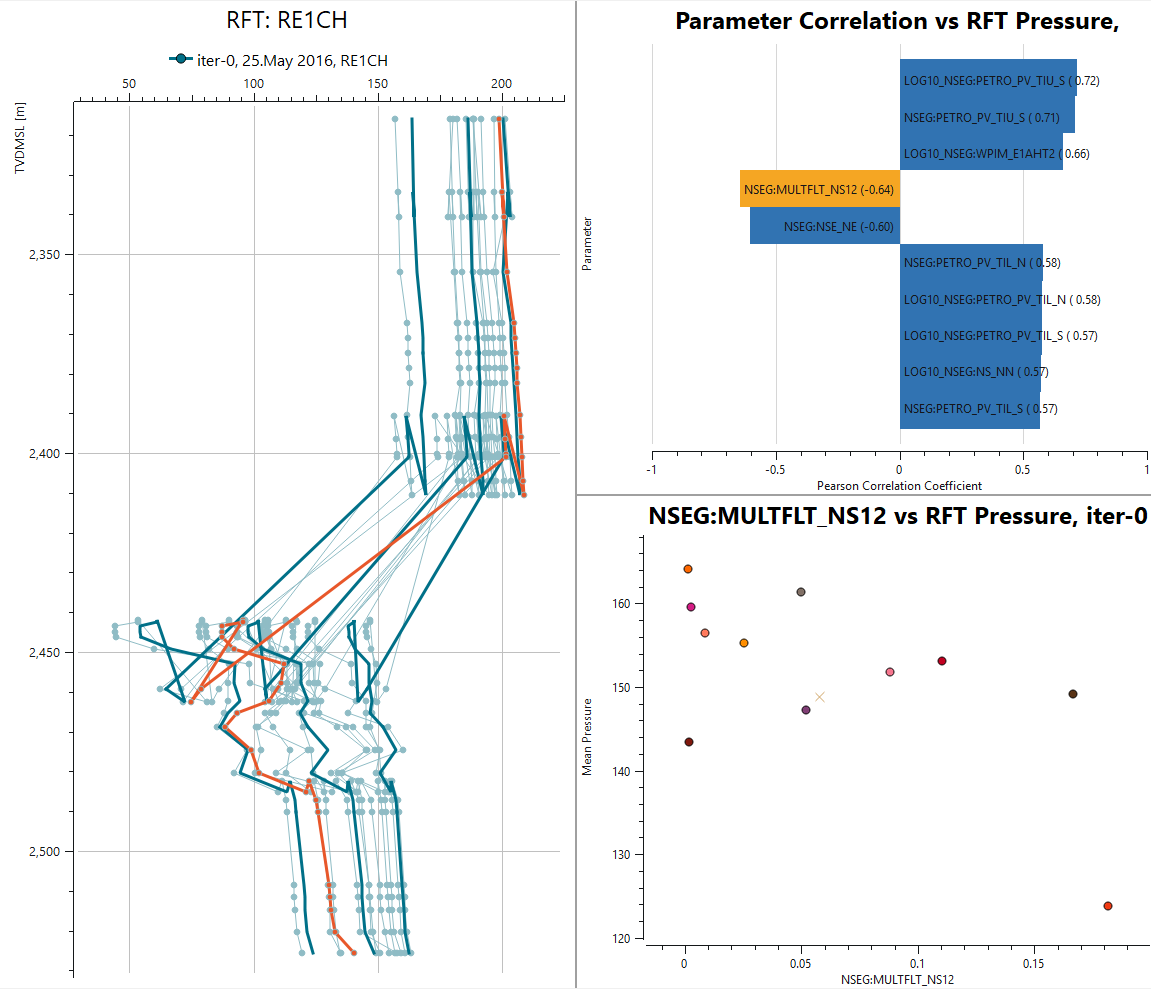
- RFT Plot – pressure versus depth (TVDMSL) for the realizations of an ensemble, as in a standard Ensemble RFT Plot.
- Tornado Plot – the ensemble parameters ranked by their correlation with the RFT pressure, shown as a tornado plot of the Pearson correlation coefficient. Positive correlations extend to the right, negative correlations to the left.
- Cross Plot – the selected ensemble parameter plotted against the mean RFT pressure, with one point per realization.
The three views are connected: selecting a bar in the Tornado Plot updates the Cross Plot to show that parameter against the RFT pressure, so the strongest correlations can be inspected in detail.
Create New RFT Correlation Plot
An RFT Correlation Plot is created from an existing Ensemble RFT Plot. Right-click the RFT plot in the Plot Project Tree and select Create RFT Correlation Report.
The new plot inherits the well, ensemble, and time step from the source RFT plot. It is created under Ensemble Correlation Plots in the Plot Project Tree, with the three views listed as sub-items: RFT, RFT Tornado Plot, and Parameter RFT Cross Plot. The plot opens in the Plot Main Window.
Property Editor
The property editor controls the data source and appearance of the plot.
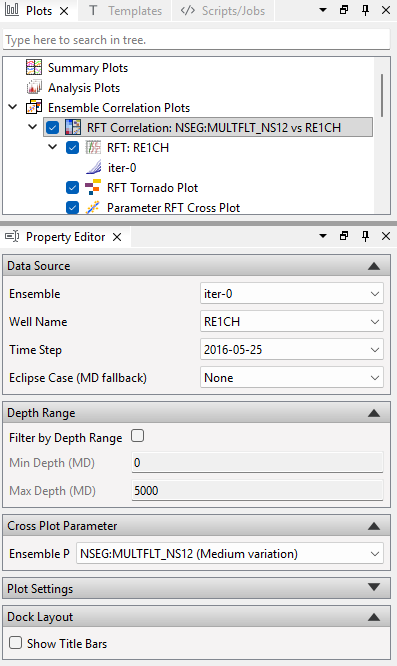
Data Source
- Ensemble – the ensemble to analyse.
- Well Name – the well whose RFT pressure is correlated against the ensemble parameters.
- Time Step – the single time step the correlation report is computed for.
- Eclipse Case (MD fallback) – a reservoir simulation case used to resolve measured depth (MD) when it cannot be derived otherwise. (Eclipse here refers to the Eclipse® reservoir simulator; Eclipse is a registered trademark of Schlumberger.)
Depth Range
- Filter by Depth Range – when enabled, restricts the correlation to a depth interval.
- Min Depth (MD) / Max Depth (MD) – the measured-depth bounds of the interval.
Cross Plot Parameter
- Ensemble Parameter – the parameter shown in the Cross Plot. Selecting a bar in the Tornado Plot updates this field, and changing it here updates the Cross Plot accordingly.
Dock Layout
- Show Title Bars – shows the dock title bars so the panels can be rearranged. See Modifying the Layout.
Parameter Correlation
The tornado view ranks each ensemble parameter by how strongly it correlates with the RFT pressure. In the example above, LOG10_NSEG:PETRO_PV_TIU_S has the strongest positive correlation (0.72), while NSEG:MULTFLT_NS12 has the strongest negative correlation (-0.64). The correlation factor is computed in the same manner as for Correlation Plots.
Parameter Cross Plot
The cross plot shows the mean RFT pressure of each realization against the value of the selected ensemble parameter, with each realization drawn as a separate point. This reveals the shape of the relationship behind the correlation coefficient – for example whether the trend is linear or driven by a few outlying realizations.
Show Plot Data
The numerical data behind the plot is available by right-clicking the plot in the Plot Project Tree and selecting Show Plot Data. This opens a text view with the underlying data for the Tornado Plot and the Cross Plot, which can be copied for use in other applications.
Modifying the Layout
The three views are arranged as dock widgets within the plot window. The default layout places the RFT Plot on the left, the Tornado Plot in the top right, and the Cross Plot in the bottom right.
By default the dock title bars are hidden, so the panels appear as a fixed layout. To rearrange them, enable Show Title Bars in the Dock Layout group of the Property Editor.
With the title bars visible, each panel can be modified using its title bar:
- Drag a panel by its title bar to redock it on another edge, or drop it onto another panel to stack the two as tabs.
- Drag a panel outside the window to leave it floating.
- Close a panel to hide that view. A hidden view can be shown again by enabling its corresponding sub-item (RFT, RFT Tornado Plot, or Parameter RFT Cross Plot) in the Plot Project Tree.
The current layout is stored with the project, so it is restored the next time the project is opened.