3D Views
3D Views are the windows displaying the Grid Models. The visualization is controlled by the Project Tree item representing the View and their sub items.
Each item has a set of properties that can be edited in the Property Editor.
Several views can be added to the same case by right-clicking the case or a view and select New View. You can also Copy and then Paste a view into a Case. All the settings are then copied to the new view.
Views of Eclipse models and Geomechanical models has a lot in common, but Eclipse views has some features that applies to reservoir simulations only.
Common view features
View properties
Grid appearance can be controlled from the Property Editor when a view is selected. This includes background color and z scaling. In addition, cell visibility controls of inactive and invalid cells.
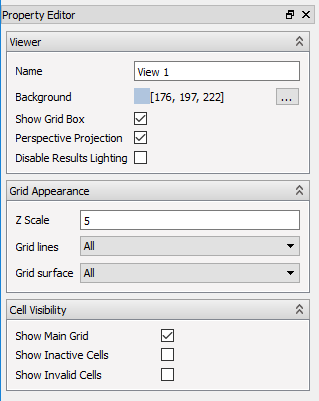
Visibility of the grid box with labels displaying the coordinates for the reservoir can also be controlled using Show Grid Box.
Store User Defined View
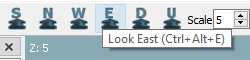
Zoom and orientation of a model can be stored using the menu item “Views->Store User Defined View”. Select the menu item “Views->User Defined View” or use a toolbar button to apply the stored view zoom and orientation to a different view.
Cell Result
The Cell Result
 item defines which simulation or Geomechanical property the 3D View uses for the main cell color. The property can be chosen in the property panel of the Cell Result item. The mapping between cell values and color is defined by the Legend Definition
 along with some appearance settings on the Legend itself. (Number format etc.)
Please refer to Result Color Legend for details.
Range Filters and Property Filters
In order to see different sets of cells, and cells inside the reservoir, Views use cell filters. Please refer to Cell Filters to read more about them.
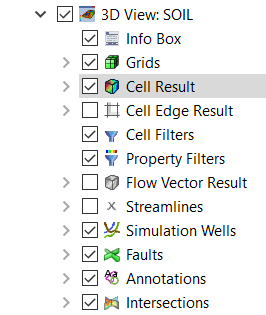
Info Box
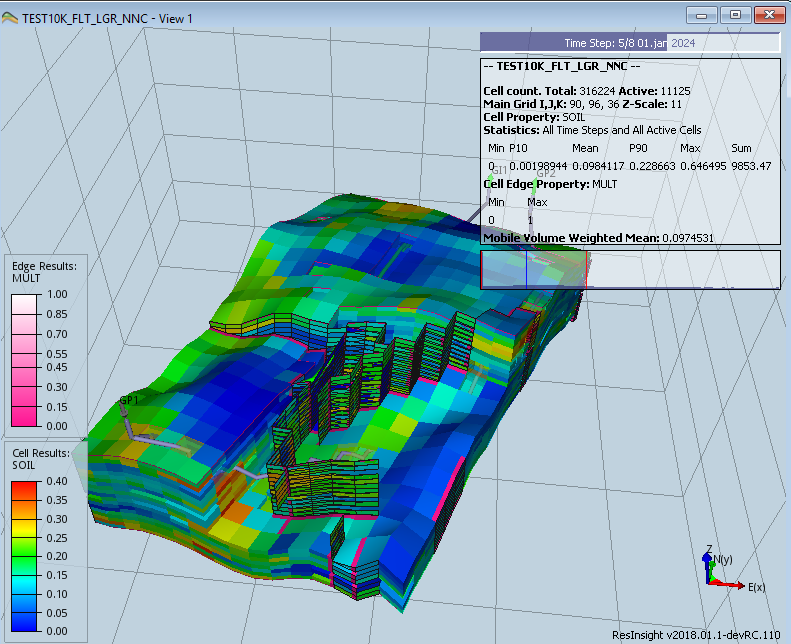
The Info Box controls the visibility of the animation progress, the Case description box, and the results histogram displayed in the top right corner of the view.
The Animation Progress shows which time step you are viewing.

The Info Text shows general info about the case, the selected results, and some statistics. Mobile Volume Weighted Mean is the mean of the current Cell Property weighted by the Mobile pore volume. For details, see Derived Results
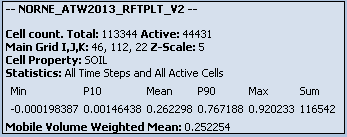
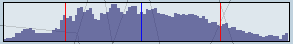
The Histogram shows a histogram of the complete time series of the currently loaded Cell Result together with:
- The mean value ( a blue line )
- P10 and P90 ( red lines )
Statistics Options
- Statistics Time Range – controls whether all time steps or only the current time step are included when statistics is computed. Flow Diagnostic results can only use the current time step option.
- Statistics Cell Range – controls if visible cells or all active cells is included when statistics is computed.
Note
The Info Box settings can be activated by clicking on the Info Text in the 3D view.
Grids
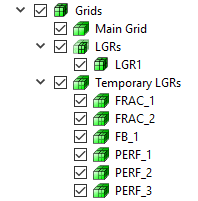
The Grids
 node contains child nodes for Main Grid, LGRs and Temporary LGRs where each grid’s visibility can be controlled. The LGRs node contains all LGRs loaded from file, while Temporary LGRs contains all temporary LGRs (see Completions LGR).
Toggling Grids off will hide all grids cell geometry. This option is used to display geometry for faults and intersections. This feature is also available as a toolbutton called Hide grid cells.
node contains child nodes for Main Grid, LGRs and Temporary LGRs where each grid’s visibility can be controlled. The LGRs node contains all LGRs loaded from file, while Temporary LGRs contains all temporary LGRs (see Completions LGR).
Toggling Grids off will hide all grids cell geometry. This option is used to display geometry for faults and intersections. This feature is also available as a toolbutton called Hide grid cells.
Intersections
Intersections
 are used to cut the geometry and show result values mapped onto this geometry.
Please refer to Intersections for details.
are used to cut the geometry and show result values mapped onto this geometry.
Please refer to Intersections for details.
Activate items by clicking
Selected overlay items in the 3D view can activate a corresponding item in the Property Editor. This is implemented for Info box and result color legends. Please note that this feature is activated by clicking inside the texture/colored part of the legend.
Eclipse features
Change Data Source for View
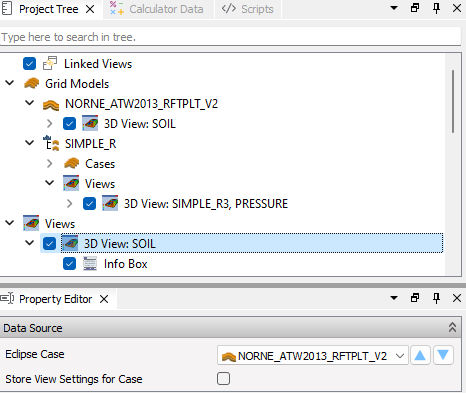
A view is usually located in the Views folder below the Eclipse case. If you create a view in the top level Views folder, it is possible to switch the case the view is connected to. Views created in a Grid Case Ensemble has the same property, making it easy to quickly navigate between the different cases in an ensemble.
If you need to keep individual view settings for each case, the rotation and zoom can be stored using the option Store View Settings for Case.
Cell Edge Results
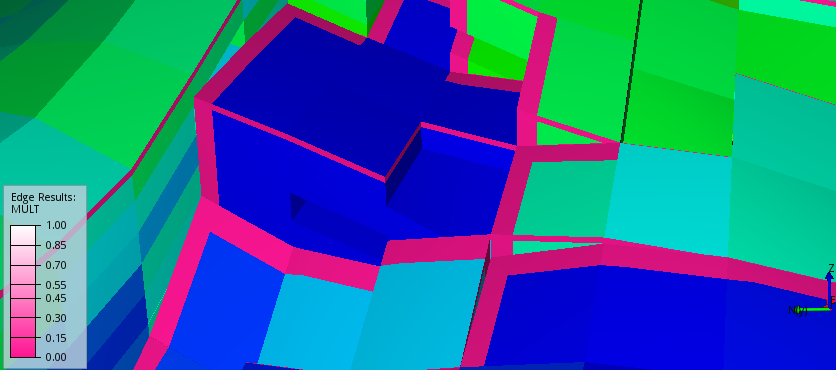
The Cell Edge Result
 visualization mode is one of ResInsight’s special features. Its main use is to show the MULT(X, Y, Z) properties at the same time. This will show the MULT property values different from 1.0 along the correct edges of the cells. In effect this highlights the faults and makes it easy to verify all the MULT values in one go.
ResInsight supports all properties ending with X, Y, Z and X-, Y-, Z-. However, it is only the MULT property that ignores values of 1.0.
When selecting a result variable for cell edge, a second legend shows up in the 3D view showing the variation in values for this second property. Color legend management is available when selecting the Legend Definition item belonging to the Cell Edge Result item.
Select Custom Edge Result to specify one cell result to be mapped onto all cell edges. This way two cell results can easily be compared and visualized in the same view. The Custom Edge Result can either be a static or dynamic result.
Separate Fault Result
Default result mapping on faults is using the result specified in Cell Result. If a different result mapping is wanted, enable the checkbox and select the result from the result selection dialog in the Property Editor. A second legend for the fault result is added to the view.
Simulation Wells
This item controls the visualization of the simulation wells. Please refer to Simulation Wells to read more.
Well Connection Factors
This item controls the visualization of well connection factors. See Visualization and Inspection of Well Connection Factors for details.
Fractures
This item controls the visualization of fractures. See Fractures for details.
Faults
Visualization of the faults in the model is controlled by this item. Please refer to Faults to read more.