Summary Plot Editor
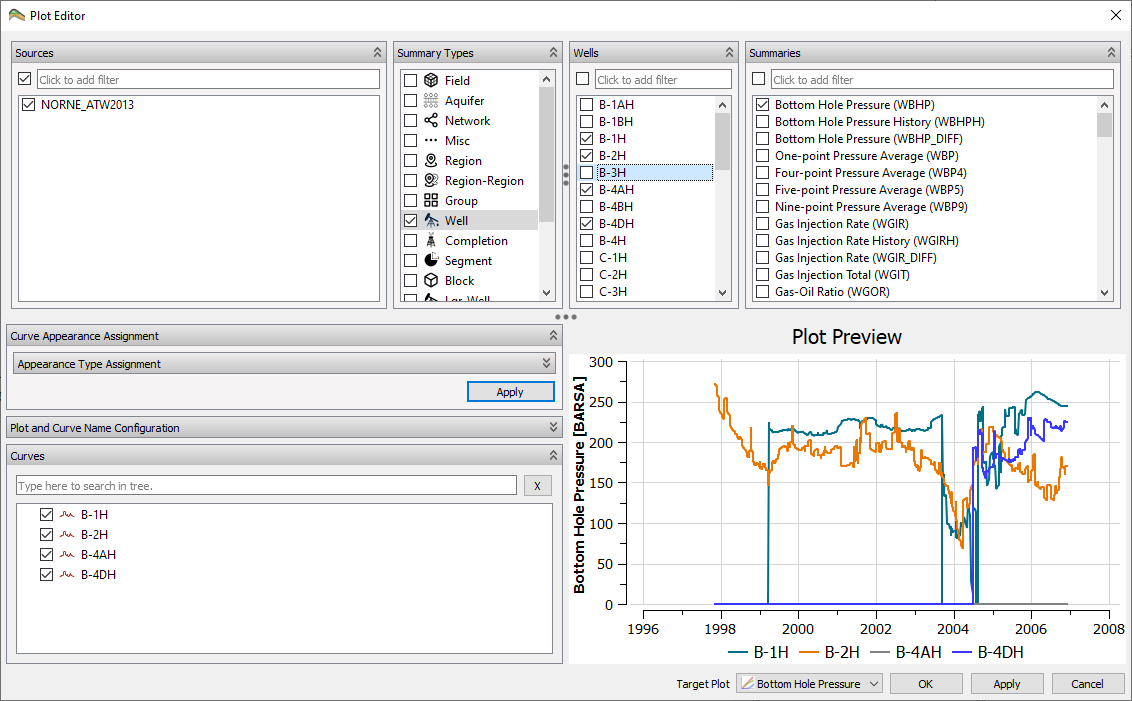
The plot editor is a separate ResInsight dialog window where the user can select which vectors to display in a summary plot. It is also possible to edit an existing plot in this editor.
The upper part of the editor contains editors for selecting which vectors/summaries to display in the plot. The number of fields vary from 3 to 6 depending on the Summary Type currently highlighted.
Here highlighted means marked item with different background color, while selected means item(s) having a ticked check box.
Selection Fields
This section describes the different selection fields in the selection part of the plot editor. A complete/valid vector selection consists of a selected source, a selected summary category, a selected item in each dynamic field (if any) and a selected vector among the Summaries.
Sources
This field contains all imported cases and ensembles. Select the case(s) and/or ensemble(s) to display in the plot.
Summary Types and Item Selection Fields
In the mid-section of the dialog, the Summary Type and the corresponding Items can be selected.
- Field – Select Field related vectors only
- Aquifer – Select Aquifer category vectors only
- Network – Select Network category vectors only
- Misc – Select vectors in the Misc category only
- Region – Select Region related vectors only
- Region-Region – Select Region to Region related vectors only
- Group - Select Group related vectors only
- Well – Select Well related vectors only
- Completion – Select Completion related vectors only
- Lgr-Completion – Select Completion in LGR related vectors only
- Lgr-Well – Select Well in LGR related vectors only
- Segment – Select Segment related vectors only
- Block – Select I, J, K – Block related vectors only
- Lgr-Block – Select I, J, K - Block in LGR related vectors only
- Calculated – Select calculated vectors created by the curve calculator.
- Imported – Select observed data vectors imported from file (e.g. CSV, RSM files)
Summaries
This field contains the summaries/vectors for the highlighted summary category.
Preview Plot
When a complete/valid vector exists, one or more curves will appear in the preview plot. Each curve will also have a corresponding item in the curves field in the lower left corner. Visibility for the curves may be controlled by the checkboxes. Each curve is automatically assigned a name and appearance. However the user may modify these settings in the Curve Name Configuration and Curve Appearance Assignment fields.
Plot and Curve Name Configuration
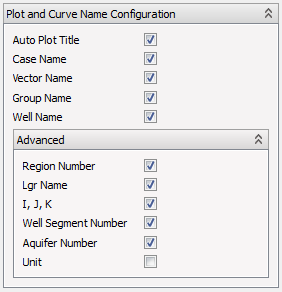
The checkboxes in this field control which information elements to include in the curve name. Toggling some of the checkboxes will have no effect on some curves depending on which information elements are relevant for each curve.
Curve Appearance Assignment
Curves created are assigned individual visual properties like colors and symbols in a systematic manner to make the plots easy to read. Different aspects of the vectors are assigned to different curve appearances. E.g. using symbols to distinguish cases, while using colors to distinguish quantity.
These assignments can be controlled using the options in the Curve Appearance Assignment group.
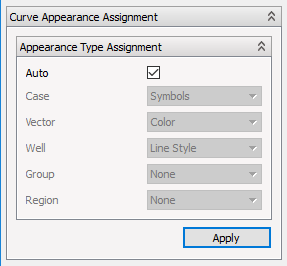
When set to Auto, ResInsight assigns visual properties based on the present vector categories and the number of different values in each category.
When disabling the Auto option, you can select which of the visual curve properties to use for which summary category. The summary category that currently can be used is Case, Vector, Well, Group and Region. The visual properties supported types are Color, Symbols, Line Style, Gradient and Line Thickness.
The Apply button must be clicked to apply the new settings to all curves.
The curve appearance settings apply to single summary curves only and do not affect ensemble curve sets. Curve sets receive their appearance automatically from a set of color ranges.
Assignment of curve appearance are incremental, and can end up as sub optimal if adding curves in several steps. Press the Apply button to apply consistent appearance settings according to the current curve selection.
Curves
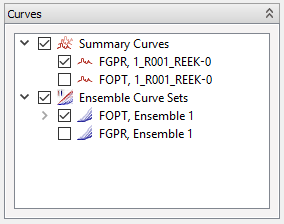
The curves field displays all summary curves and ensemble curve sets matching the settings in the selection fields. Those are separated in two groups, Summary Curves and Ensemble Curve Sets. The check box at each item controls which items are displayed in the preview plot.
If the user make a selection that will result in a huge number of ensemble curves, ResInsight will display a drawing performance warning, and the newly created curve set(s) are toggled off by default.
Target Plot


In the bottom of the dialog window Target Plot may be specified. The target plot is the summary plot that will receive the selected curves when the OK or Apply button is clicked.
By default the target plot is set to (new plot) or to the plot selected for editing when invoking the command.
Setting the target plot to a different plot will add the selected curves to that plot when pressing the the OK or Apply button.