Grid Statistics Dialog
ResInsight 3D Views has an info box in the upper right corner displaying statistics for the current view. A more detailed version of this information may also be displayed in a separate dialog window. Right click on the 3D view background and select Grid Statistics to bring up the dialog.
Grid Statistics Dialog Fields
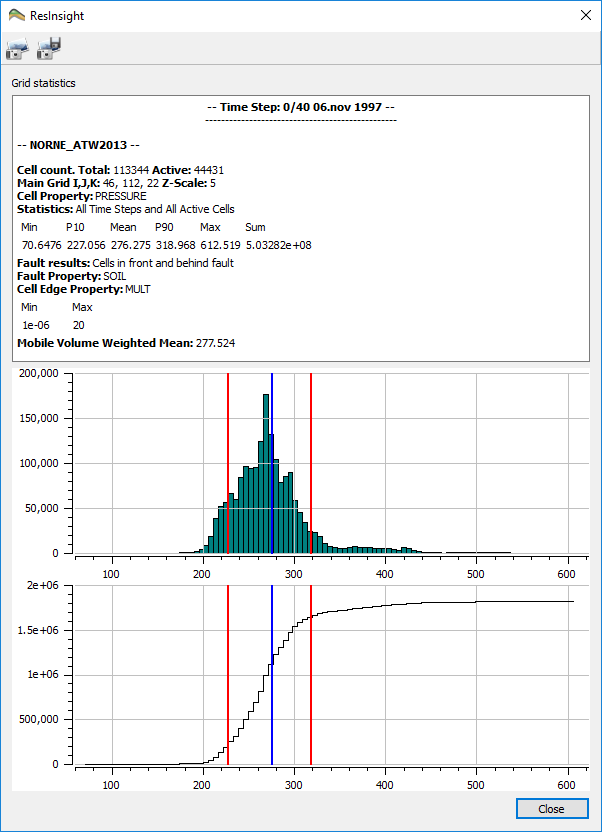
The dialog consist of three information parts.
- Info text
- Histogram
- Cumulative Histogram
Info Text
The Info Text field shows general info about the case, the selected results, and some statistics.
Histogram
The histogram shows a histogram of the complete time series of the currently loaded Cell Result together with:
- The mean value ( a blue line )
- P10 and P90 ( red lines )
Cumulative Histogram
The cumulative histogram shows av accumulated version of the histogram above.
Grid Statistics Configuration
A grid statistics dialog is always connected to the 3D view from where it was opened. When the contents of the 3D view changes due to user interactions, the grid statistics dialog contents will be updated automatically along with the info box. The Statistics Options of the info box is shown in the figure below with default settings. These settings become available by clicking in the info box or the info box node in Project Tree.
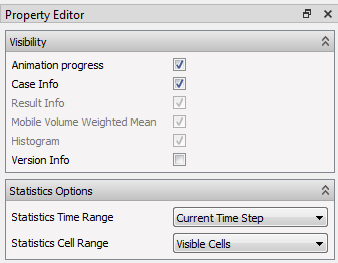
The options in the Visibility group apply to the info box only and do not affect the Grid Statistics dialog, while the options in the Statistics Options group affect both.
Statistics Options
- Statistics Time Range -– Controls whether all time steps or only the current time step are included when statistics is computed. Flow Diagnostic results can only use the current time step option.
- Statistics Cell Range -– Controls if visible cells or all active cells is included when statistics is computed.
Snapshot
The Grid Statistics dialog has a toolbar containing two buttons for snapshot functionality. The leftmost button copies a snapshot of the dialog contents to the operating system’s clipboard, while the rightmost button creates a file containing the snapshot.
The main window also has a snapshot toolbar containing the button Snapshot All Views. This button will include a snapshot of the Grid Statistics dialog if opened.