Saturation Pressure Plots
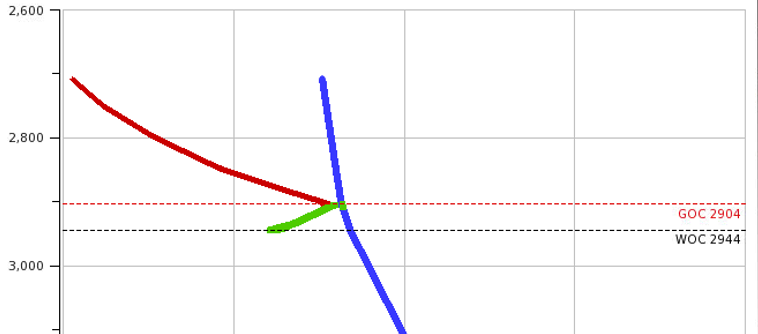
A Saturation Pressure Plot a plot displaying bubble and dew point pressures, together with initial pressure in model, versus depth. Fluid contacts (GOC and/or OWC) are displayed as annotation lines in the generated plots. One Saturation Pressure Plot is created for each equilibrium region.
To be able to create these plots, output of saturation pressures need to be specified in the SOLUTION section of the Eclipse “.DATA” file.
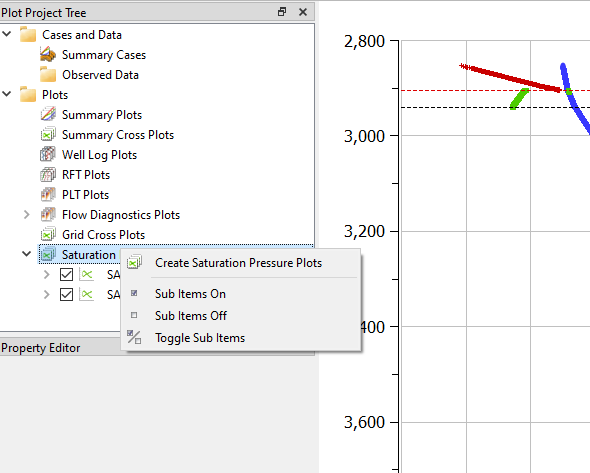 To create these plots, right click on the view in the Property Editor, and select Create Saturation Pressure Plots. It is also possible to create these plots by right click on the item Saturation Pressure Plots in the Property Editor in the Plot Window.