Flow Results
Flow Results lets the user investigate flow properties and fluxes in a reservoir, e.g. by flow vector visualizations selecting and combining different fluids and directions.
Flow Vectors
Flow vectors are computed based on the Eclipse properties FLRGASI/J/K FLRWATI/J/K FLROILI/J/K. Visualization of flow vector results always use velocity instead of rate. Velocity is computed as flow rate divided by cell face area.
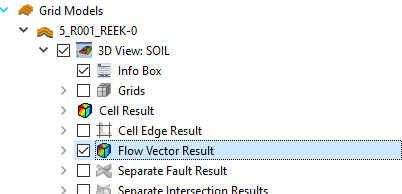
In order to show flow vectors, check the checkbox next to Flow Vector Result in Project Tree.
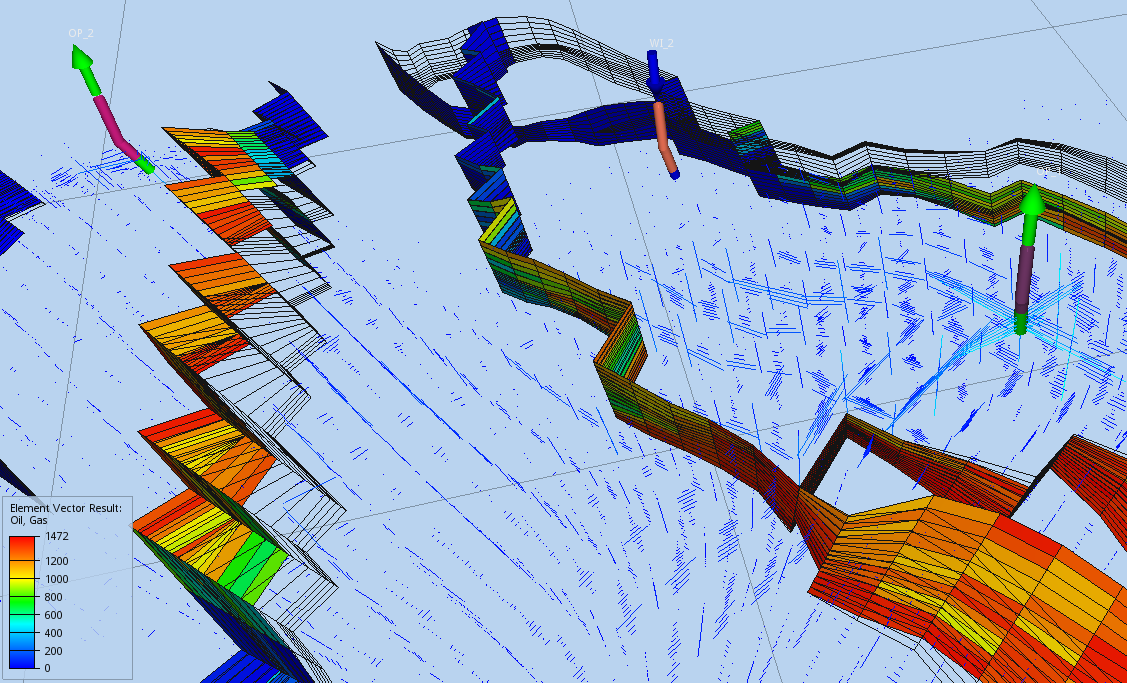
This updates the 3D View with arrows visualizing the fluxes for the given time step or animation. The directions, data source fluids, color, scale and threshold can be adjusted in the Property Editor.
The legend in 3D View maps the Flow Vector colors to their respective result values. By default it shows the max values for all time steps. The legend settings can be changed in the Color Legend sub item of the Flow Vector Result item in Project Tree.
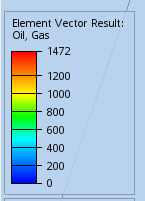
When combining several fluids, the max value shown in legend is an aggregation of the single max values of each selected fluid. This means that this number might be higher than the result of any flow vector.
Flow Vector Settings
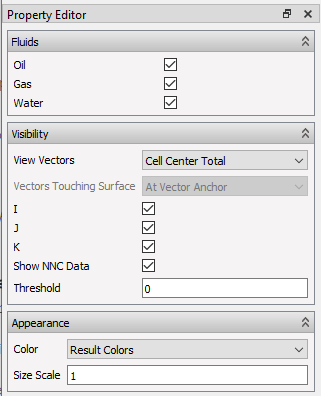
The Property Editor controls the following settings:
-
Fluids: Selection of fluids for displaying fluxes as aggregated vectors in 3D view.
-
Visibility
– View Vectors: Select Per Face to show one flow vector per cell face or Cell Center Total to show only one vector per cell center (as an aggregation of all single direction vectors).
– Vectors Touching Surface: Select At Vector Anchor to display vectors starting at cell faces or At Vector Center to center vectors at cell faces. Vectors Touching Surface is enabled when View vectors is set to Per Face.
– I/J/K: Use flows in I/J/K direction for computing vectors.
– Show NNC data: Visualize flows between non-neighbouring cells.
– Threshold: All vectors with flow result values below this number are hidden.
-
Appearance: Select Result Colors to color vectors according to Element Vector Result legend in 3D View or Uniform for uniform color. Use Size Scale to scale vector length.
Cell Result View
ResInsight may visualize intercell flows, flow rates, and transmissibilities as Cell Results optionally divided by face area, c.f. check-box Divide By Area below. For instance, the option enables comparison of horisontal and vertical flow velocities as alternative to flow rates as the latter is typically influenced by significant differences in cell face areas.
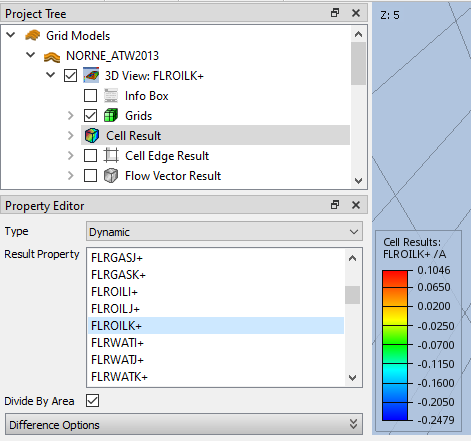
Specifically, the check-box Divide By Area is applicable to Eclipse properties FLROIL, FLRGAS, FLRWAT, FLOOIL, FLOGAS, FLOWAT, and transmissibilities TRAN and riTRAN. These results are listed in ResInsight postfixed by IJK+- or XYZ as shown above. As seen, checking Divide By Area is reflected by text /A in legend.