Cell Results
The main results to post process in ResInsight are Cell Results. A Cell Result is one value, or a small set of values per cell over a region of the grid. A Cell Result is also referred to as a Property.
Cell Results are used in several operations and settings:
- Cell Colors
- Cell Edge Result (Eclipse Only)
- Separate Fault Result (Eclipse Only)
- Property Filters
- Well Log Extraction Curves
- Cell Result Time History Curves
In the property panel of all those, the same options are used to define the Cell Result of interest.
In the following we will describe these options.
Eclipse Result Types
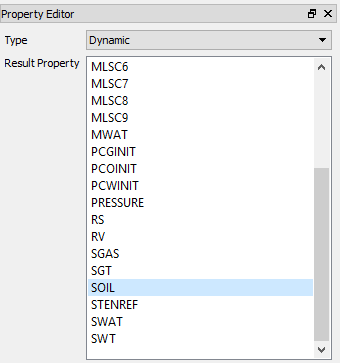
Results and difference options are displayed by the Property Editor.
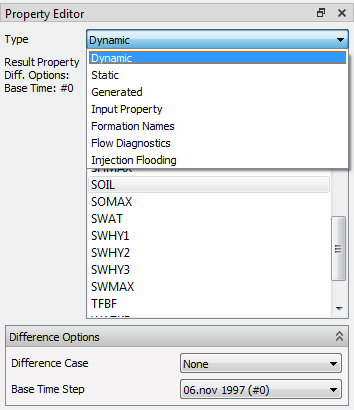
The different result types are:
- Dynamic – Time varying properties of a simulation and derived properties calculated by ResInsight, c.f. Derived Results
- Static – Properties that do not vary with time and derived properties calculated by ResInsight, c.f. Derived Results
- SourSimRL – Available if SourSimRL results have been imported, c.f. SourSimRL Import
- Generated – Results generated by an Octave Script
- Input Property – Directly imported reservoir simulation properties from ascii files
- Formation Names – Lists only the Active Formation Names selected on the case, c.f. Formations
- Flow Diagnostics – Flow diagnostic results derived from a flux field, c.f. below
- Injection Flooding – Calculation of derived property based on one or more selected simulation tracers, c.f. below
Difference options are:
- Difference Case – Base case for calculation of difference
- Base Time Step – Base time step for calculation of difference
For some cell face results, it is possible to normalize the results by cell face area.
Note
The difference option is not applicable for TERNARY result display.
Flow Diagnostic Results
ResInsight has embedded Flow Diagnostics calculations made available using the Flow Diagnostics result type. These results make it easier to see how and where wells interact with the reservoir and each other. It is possible to select exactly what wells to investigate, and even the possible opposite flow part of the well.
See also Flow Diagnostics Plots and Flow Characteristics Plot
Method
The calculations are performed by a library called opm-flowdiagnostics developed by SINTEF Digital.
This method is based on the presence of a flux field, and will use the flux field written to the result data file (Cell Properties: FLRGAS, FLRWAT, FLROIL) if available. If these are not available, the flux field is estimated by algorithms in the opm-flowdiagnostics-applications library based on pressure differences, relative and absolute permeability and viscosity. Other effects are not included.
A more elaborate description of the technique and how it can be utilized, can be found at Sintef’s web site. The MRST tool described is a Matlab predecessor of the flow diagnostics calculations developed for ResInsight.
The methodology is also described in: The application of flow diagnostics for reservoir management SPE J., Vol. 20, No. 2, pp. 306-323, 2015. DOI: 10.2118/171557-PA
Cross Flow and Opposite Flow
The opposite flow of a well denotes the flow that is opposite to the expected normal state of the well. E.g. parts of a producer might actually be injecting due to cross flow, and an injector could be producing in some sections. Each well is assigned an opposite flow name by adding “-XF” to the end of the name. “-XF” was chosen as a reference to Cross Flow.
In this way, a producer will have two tracer names: The “well name” as a producer tracer, and “well name-XF” as an injector tracer.
Defining Results
There are several options available to define the particular result you want to target, as shown below:
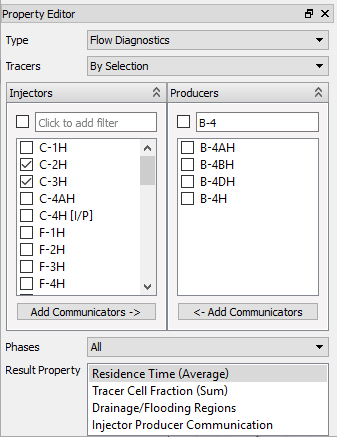
There are two main selections you need to make: The tracers and the result property
- Tracers – Option to select how/what tracers to use. Available options are:
- All Injectors and Producers – Selects all the wells, including the opposite flow tracers
- All Producers – Selects all producer tracers, including the opposite flow tracers of injectors.
- All Injectors – Selects all injector tracers, including the opposite flow tracers of producers.
- By Selection – Displays lists of all the injector tracers and producer tracers side-by-side allowing any to be selected freely.
- Both lists of selectable tracers can be filtered by typing in parts of the name.
- The tracers will have a suffix of [I/P] if they are both injector and producer, thus appearing in both lists.
- All producers communicating with the selected injectors (and vice-versa) can be selected with the “Add Communicator” buttons.
- Phases – Select the fluid phase you are interested in: All, Oil, Gas or Water. If one of the separate phases are selected, only the Time Of Flight result property will be available in the list below.
- Result property – Displays a list of the available results:
- Residence Time – The time for some fluid in the cell to reach a producer, or the time it takes to reach the cell from an injector. The option changes name depending on the selection of injectors and producers and will be Forward Time of Flight if only injectors are selected and Reverse Time of Flight if only producers are selected. When selecting several tracers, the time of flight values from each of the tracers are weighted by their cell fraction before they are averaged. The suffix (Average) will then be added to the option label.
- Tracer Cell Fraction (Sum) – The volume fraction of a cell occupied by the selected tracers. The injector and producer tracers counts as independent in this regard, so the sum of fractions for all the producer tracers will be 1.0 and the same for the injector tracers. If both types of tracers are selected, the total sum will normally reach 2.0.
- Drainage/Flooding Regions – Shows which of the selected tracers that has the largest fraction in each cell. This is shown as a category result displaying a color for each tracer, and the names in the legend. If only injectors are selected, this option will be labelled Drainage Regions and if only producers are selected, it is called Flooding Regions.
- Injector Producer Communication – The communication in a cell between a set of producers and a set of injectors is calculated as the sum of producer fractions multiplied by the sum of injector fractions in the cell. This produces values between 0.0 and 1.0 where high values indicate that both the injectors and the producers have a high influence.
On-Demand Calculation
The flow diagnostics results are only calculated when asked for, and only for requested time steps. This means that statistics based on all time steps are not available for these results.
Injection Flooding
This result type is used to plot derived results based on a selection of simulated tracers, typically seawater injection. Currently the only derived property available is Water Flooded PV. Please refer to Derived Results for more information.
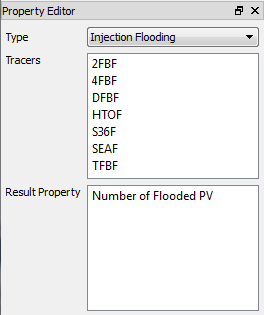
- Tracers – Lists the available reservoir simulation tracers from the reservoir simulation case. The list is produced by showing only the properties with names ending with the letter “F”. Select the tracers you want to investigate.
- Result Property – Select the variable you want to calculate. (Number Of Flooded PV is currently the only one)
Geomechanical Results
Geomechanical results are sorted in different Result Positions:
- Nodal – Results given a value per node in the grid
- Element Nodal – Results with values per element node
- Integration Point – Results with values per integration point. These are displayed in the same way as element nodal results.
- Element Nodal on Face – Results with values transformed to element faces or intersections. See Element Nodal on Face for more information
- Formation Names – Lists the Active Formation Names selected on the case. ( See Formations )
- Element – Imported element property table results. One value pr element. See Element Property Table Import
Several derived cell properties are calculated. Please refer to Derived Results for more information.
Relative Result Options
This group of options controls time-lapse results to be calculated. ( See Relative Results for more information )
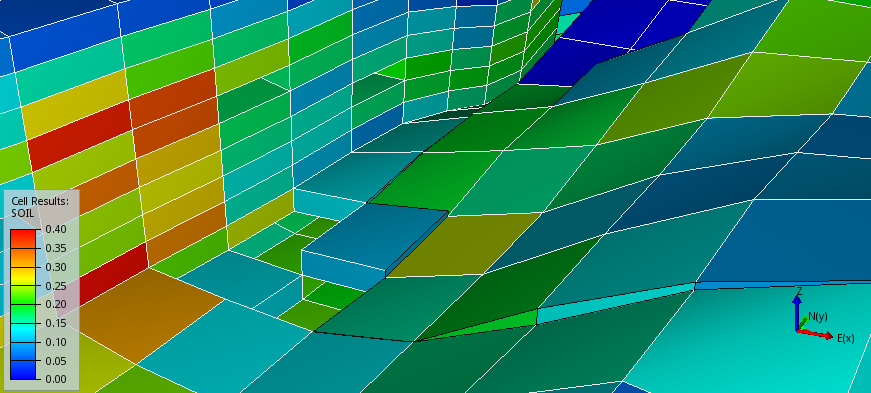
Select Color Result
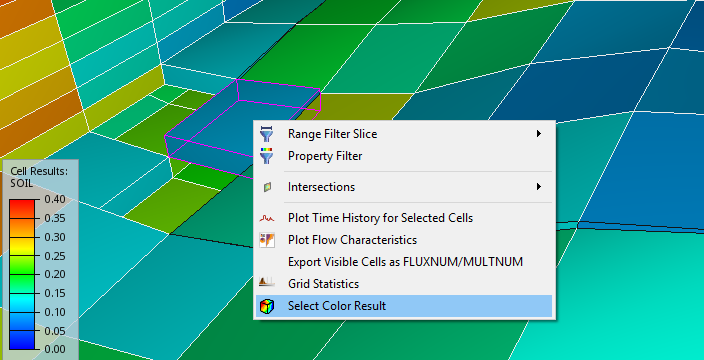
In the 3D view, the result property for a selected cell can be found by right-clicking on the 3D view and choosing Select Color Result. The corresponding result property will be shown in the Property Editor.