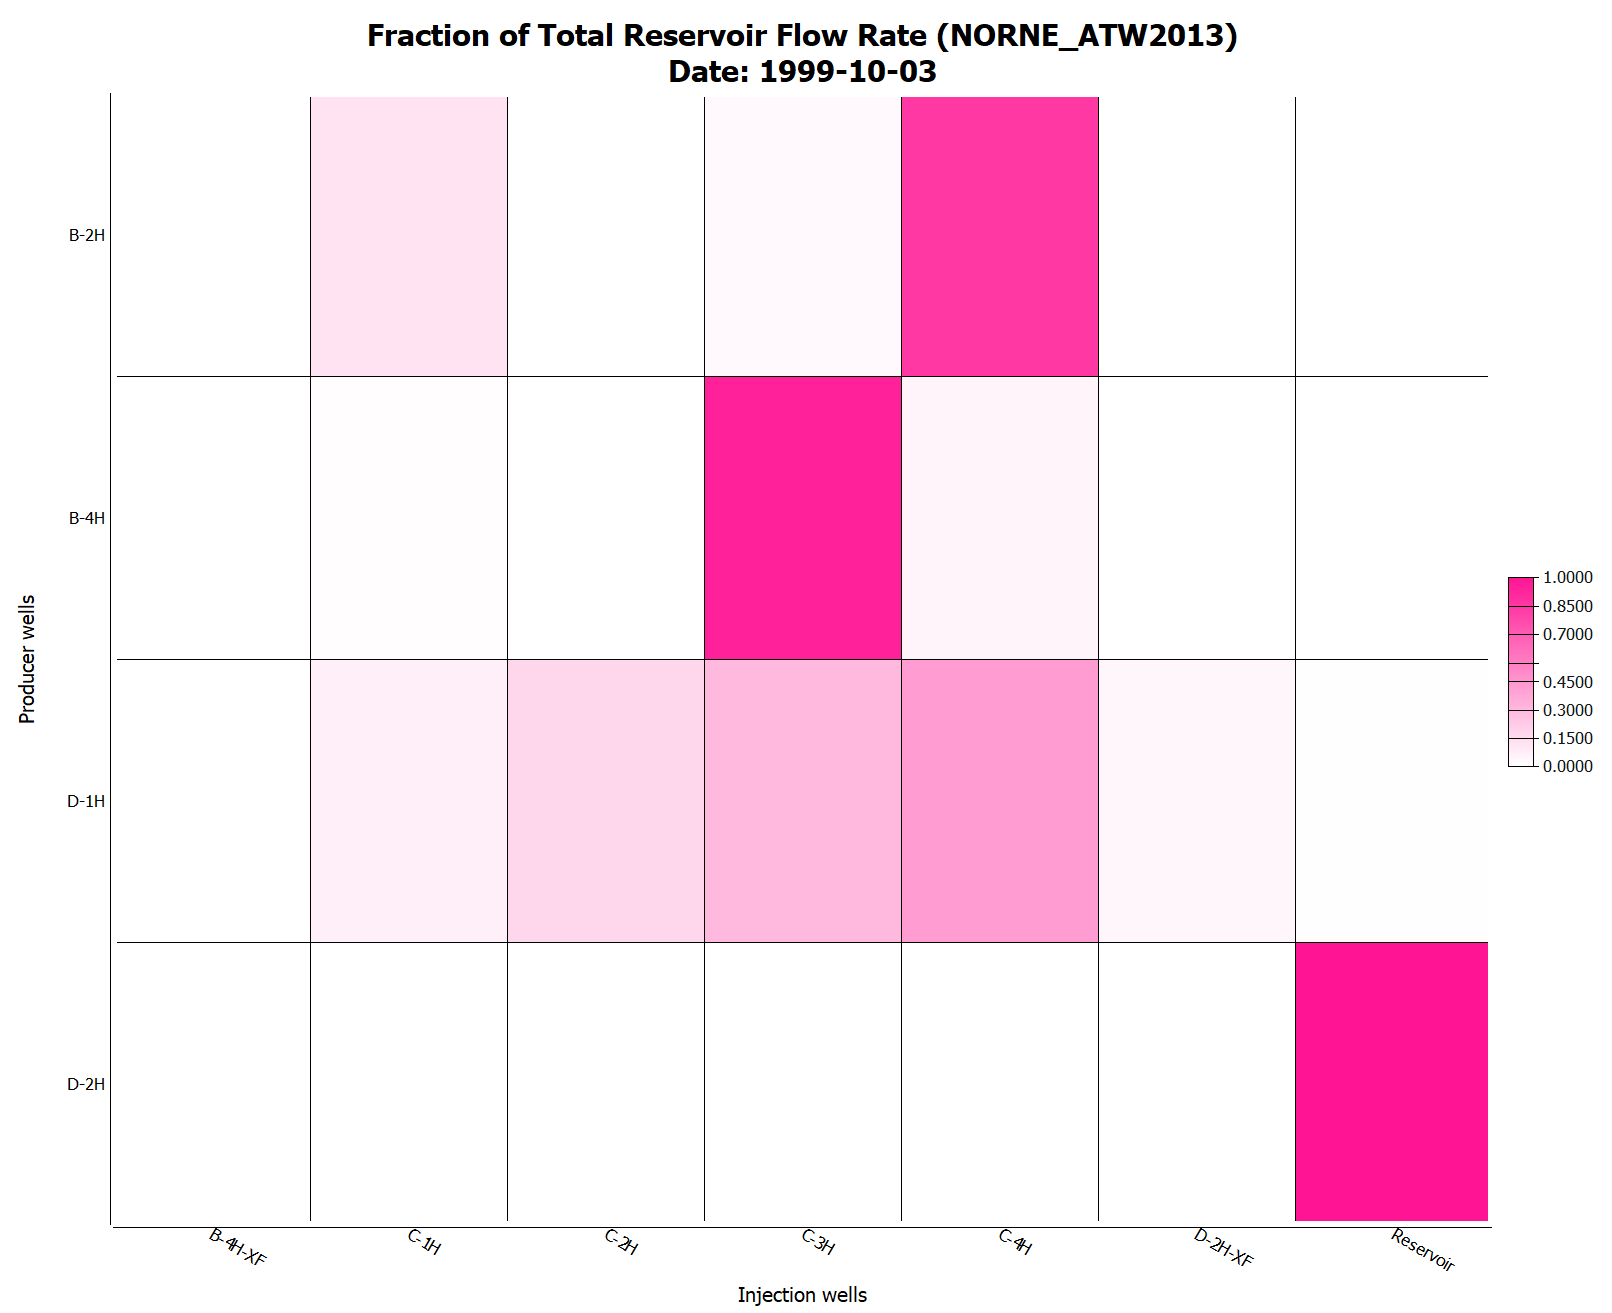
Producer/Injector Connectivity Tables
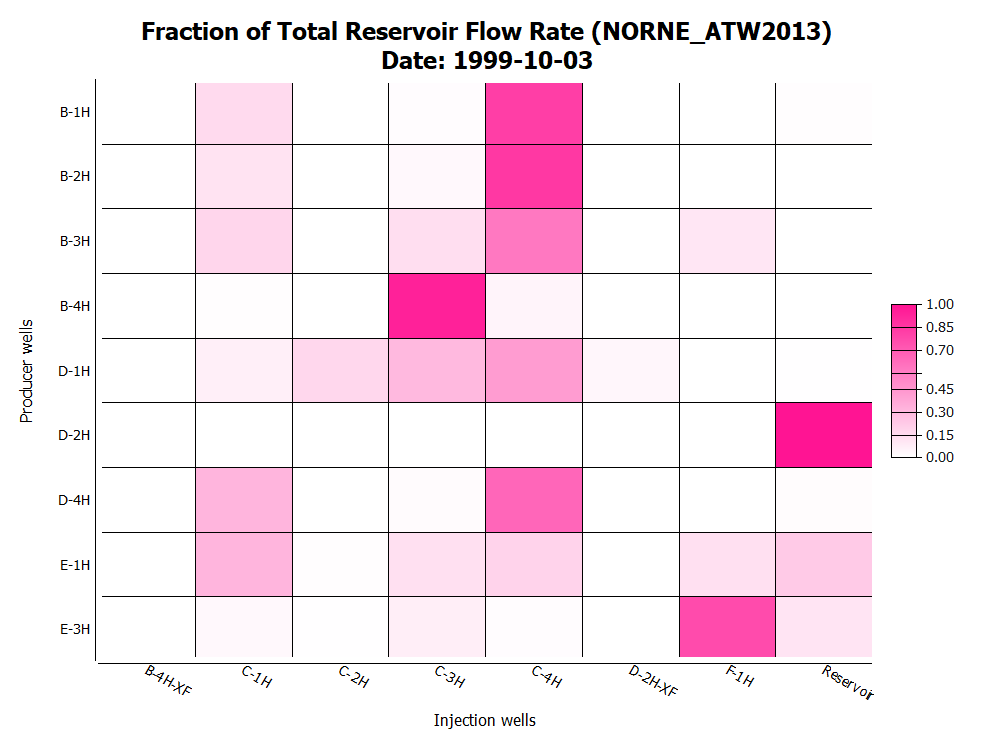
Producer/Injector Connectivity Tables is a display of Flow Diagnostics Data as a color map in table format. The table either shows flow rate data for a single time step, or accumulated flow volume data over a range of time steps.
The table lists one producer per row and one injector per column. The cell data is the flow rate data or accumulated flow volume data based on the selected Time Step Type. This table data provides an overview of the communicating wells in the reservoir, and shows which injector contributes to which producer, and who are the largest contributors to production.
The table can be formatted by use of the Property Editor, shown below. The cell data type is controlled by Value Type and the rows/columns can be filtered by selectecting producers and injectors in the Tracer Selection. Columns are controlled by the selection of resampling, and rows are controlled by selected Threshold value and Exclude Rows.
Creating Producer/Injector Connectivity Tables
The Producer/Injector Connectivity Tables are a part of the Flow Diagnostics Plots. Click here for how to generate the plots from 3D view.
Editing Table
The settings for the Producer/Injector Connectivity Table is listed in the Property Editor.
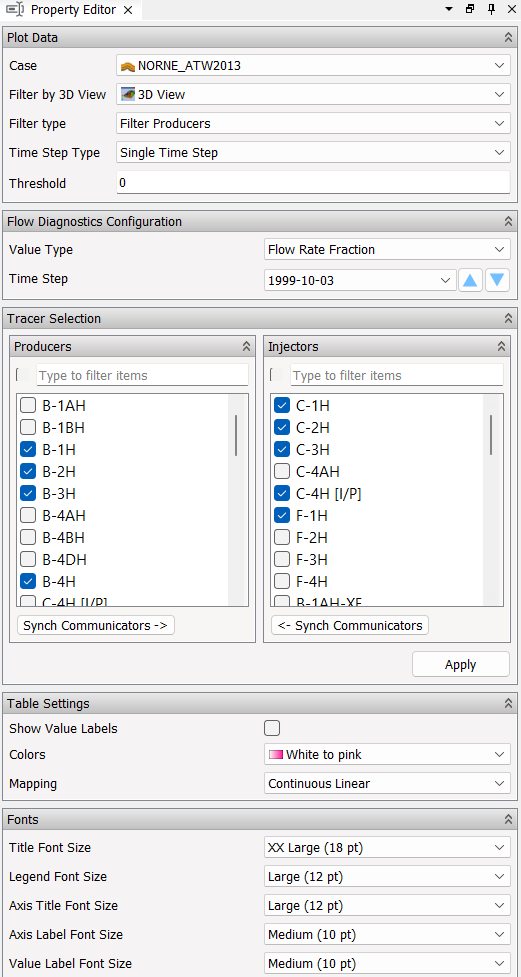
The main controls for a Producer/Injector Connectivity Table is listed below:
Plot Data
The plot data can be configured, and controls are depending on selections in Filter by 3D View.
- Filter by 3D View - Utilize the active filters in 3D view (see Filter) to collect which wells are present in the visible cells.
- Time Step Type - Select between single time step or a range of time steps.
- Single Time Step - Shows flow rate - as raw value, fraction or percentage.
- Time Step Range - Shows accumulated flow volume - as raw value, fraction or percentage.
- Threshold - Set threshold value for injectors. Exclude columns (injectors) if no row in column has value above threshold.
With filtering Disabled:
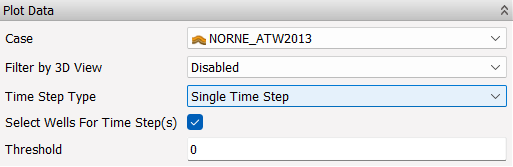
- Select Wells For Time Step(s) - Automatically select producer and injector wells present for selected time step(s):
With filtering Enabled:
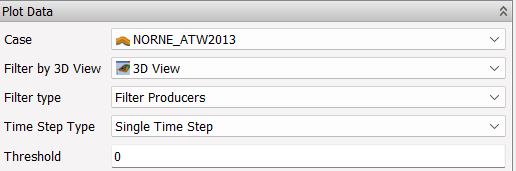
- Filter type - Select how to apply the 3D view filtering to the table data.
- Filter Producers - Select producer wells visible in selected Filter by 3D view, and synch communicating injectors.
- Filter Injectors - Select injector wells visible in selected Filter by 3D view, and synch communicating producers.
- Calculate By Visible Cells - Provide the cell filter to the calculation of well flow, and produce flow rate and accumulated flow volume data only using the cells present in the visible cells of 3D view.
Flow Diagnostics Configuration
The content of flow diagnostics configuration is dependent on the selected Time Step Type.
- Value Type - Select which value type to fill in table cells
- Single Time Step - Select between Flow Rate, Flow Rate Fraction and Flow Rate Percentage
- Time Step Range - Select between Accumulate Flow Volume, Accumulate Flow Volume Fraction and Accumulate Flow Volume Percentage
Single Time Step:
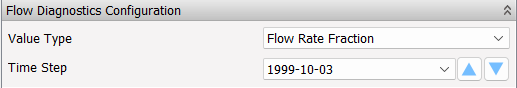
- Value Type - Select which value type to fill in table cells: Flow Rate, Flow Rate Fraction and Flow Rate Percentage.
- Time Step - Select which time step to get data from
Time Step Range:
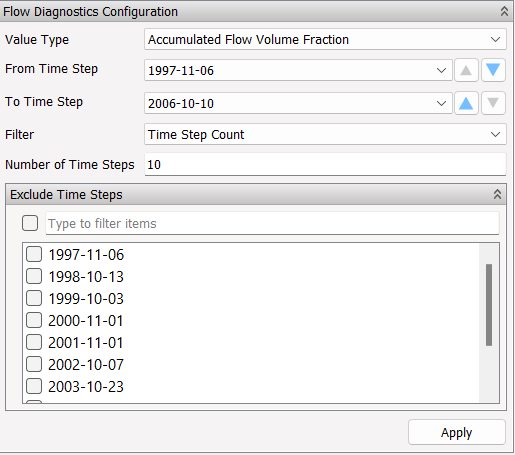
- Value Type - Select which value type to fill in table cells: Accumulate Flow Volume, Accumulate Flow Volume Fraction and Accumulate Flow Volume Percentage
- From Time Step - Select time step to start range from.
- To Time Step - Select time step to end range on.
- Filter - Filter number of time steps to include: Show All Time Steps or Time Step Count.
- Number of Time Steps - Set number of time steps to include between From and To selection.
- Exclude Time Steps - Exclude specific time step if wanted.
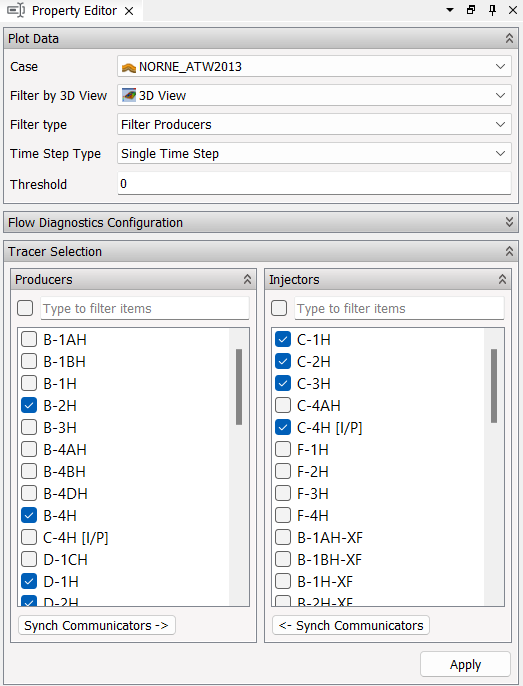
Tracer Selection
Select which Producers and Injectors to include in the table. If no wells are selected, no filtering is active - thereby all producers and injectors present among the selected time steps are visible in the table when values are above threshold.
An example of applying a Slice Filter in Filter by 3D View and select Filter Type: Filter Producers, produces the following Tracer Selection and table view:
Note: If a selected well does not exist among the selected time steps, it will not be present in the table.