Summary Tables
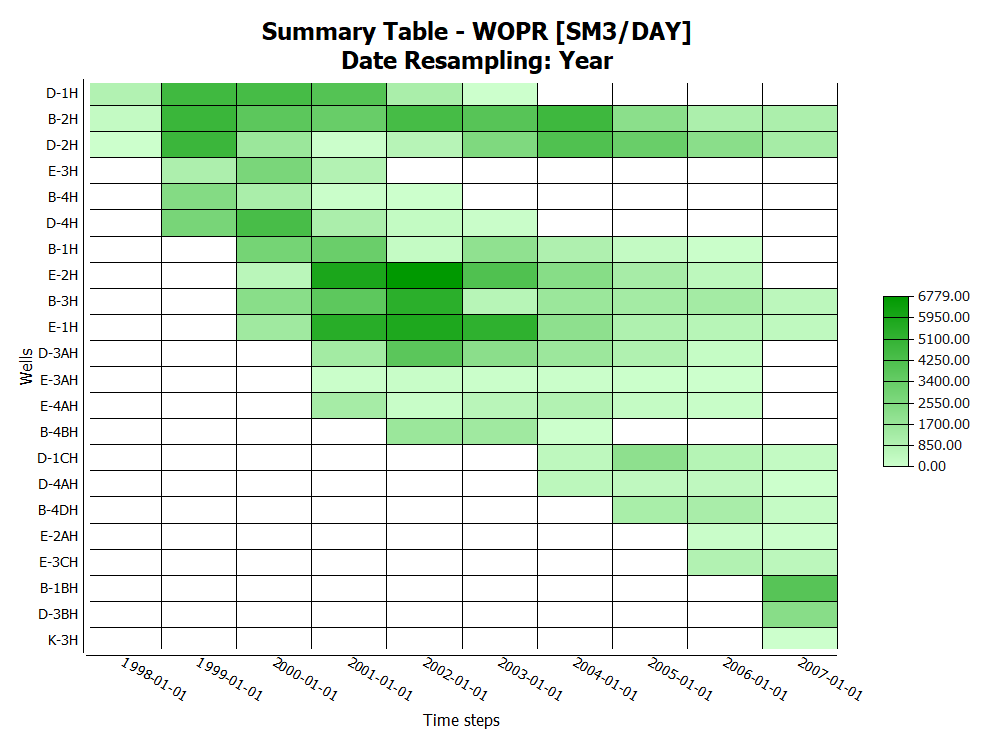
Summary Tables are a display of curve data based on Eclipse Summary Data as a color map in table format. It shows summary data of vectors for the selectable categories: Well, Group or Region.
Summary tables are displayed with the summary vectors on each row, and time step values according to selected Date Resampling in each column - as shown with resampling Year in the screenshot above.
The table can be formatted by use of the Property Editor, shown below. Columns are controlled by the selection of resampling, and rows are controlled by selected Threshold value and Exclude Rows.
Creating Summary Tables
Using Data Sources to create Summary Tables
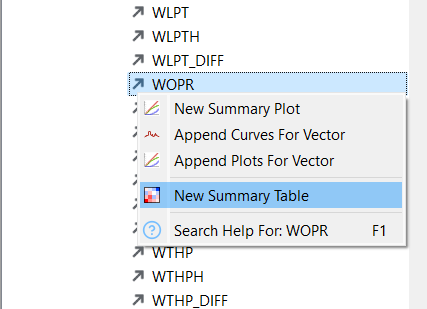
Having imported Eclipse Summary Data, Data Sources provides an easy approach to create Summary Tables:
- Search or navigate Data Sources to find the desired source and vector
- Right-click selected vector and select New Summary Table
Duplicate Summary Table
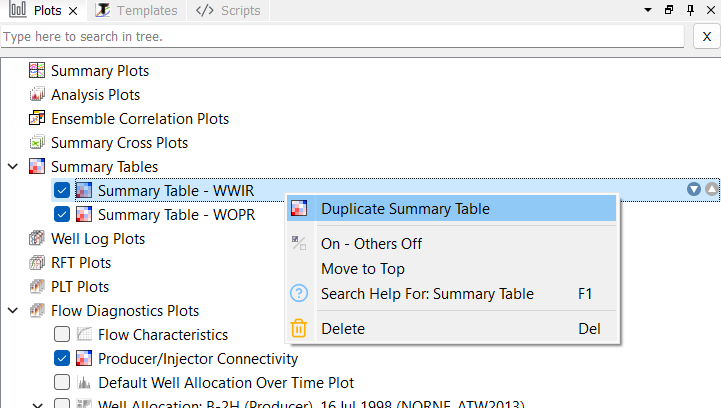
When a Summary Table is created and configured, the table can be duplicated by Right-click on the respective table in the Project Tree and selecting Duplicate Summary Table. This creates a new Summary Table with the same configuration, and a new table can be created with minor adjustments in the Property Editor.
Create default Summary Table
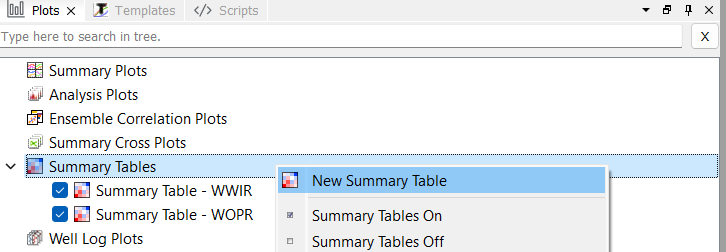
A default Summary Table can be created by Right-click on the Summary Table collection and select New Summary Table. This creates a new default Summary Table, which can be configured by selections in the Property Editor
Editing Summary Table
The settings of each table is listed in the Property Editor for a Summary Table. By selecting a Summary Table, its properties are displayed.
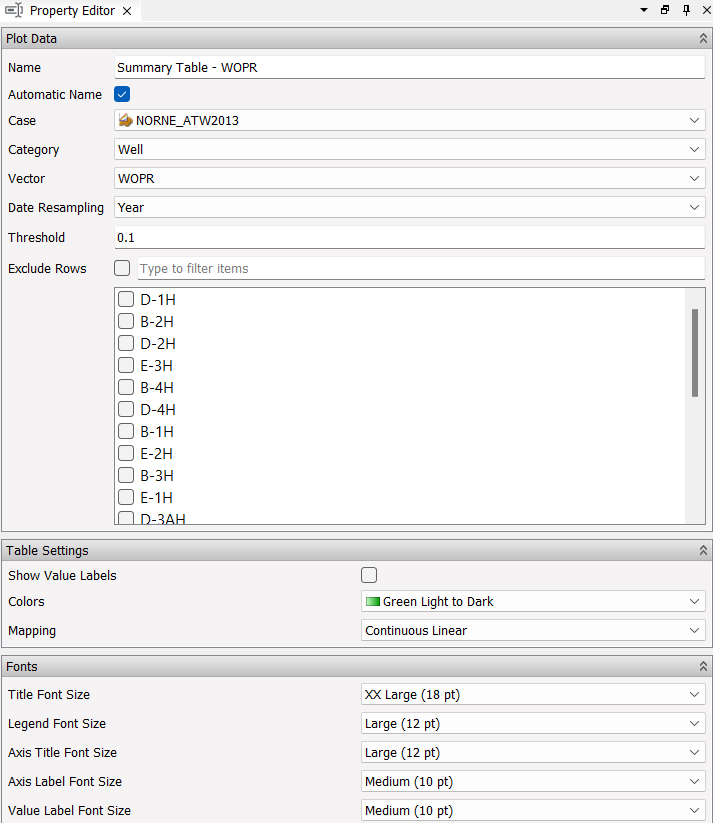
The main controls for a Summary Table is listed below:
- Category - Select which category to select vectors from: Well, Group or Region.
- Vector - Selection of vector type available for selected category in case.
- Date Resampling - Select date resampling to control number data values for each vector - i.e. number of columns. The resampling is ensuring equal time stamps across all summary vectors in table.
- Threshold - Set threshold value for summary vector. Exclude row (vector) if each time stamp value are below selected threshold.
- Exclude Rows - Select which rows (vectors) to exclude from the table.