What's New in 2019.12
ResInsight 2019.12 is the latest version of ResInsight, the professional quality, open source 3D visualization, curve plotting and post-processing tool for reservoir models and simulations. Version 2019.12 is a major update bringing a range of significant new and enhanced features. Some of the most important extensions are listed below.
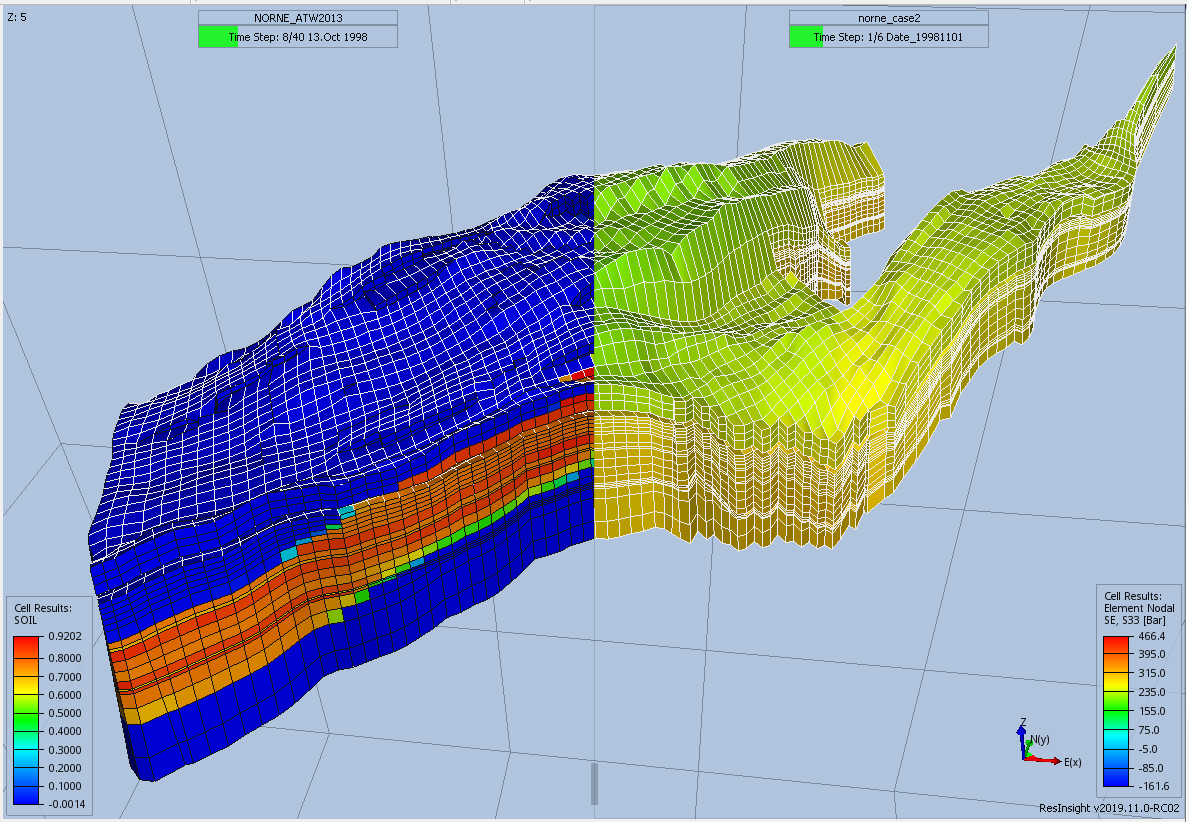
Comparison View
ResInsight offers a Comparison View to compare two existing views in terms of grid geometry, results, intersections and more. The Comparison View allows comparison of information of different grids and different solutions on the same grid in a single view. This improves efficiency and simplifies the workflow when working with related but different models.
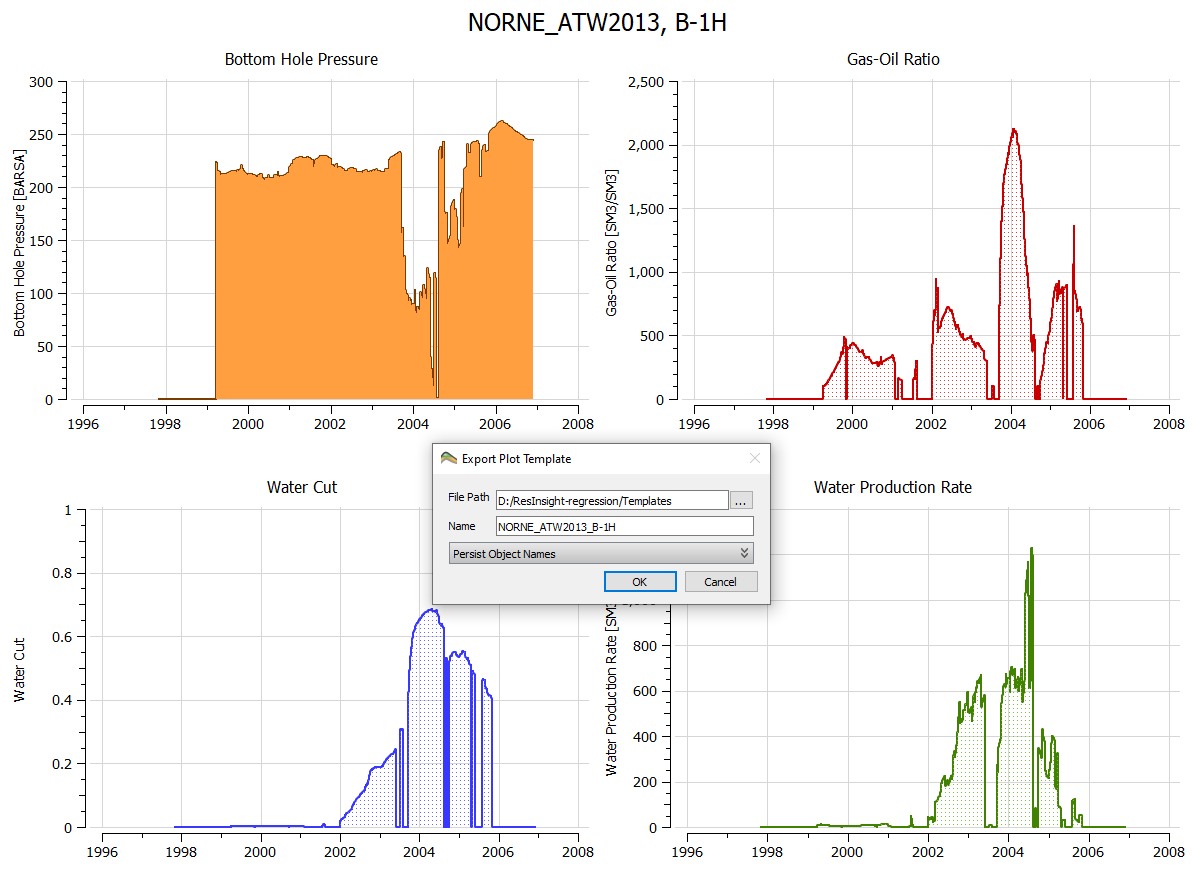
Support for Summary Plot Templates
ResInsight 2019.12 includes numerous enhancements to Summary Plots and notably support for Summary Plot Templates which are defined by a number of curves with preset appearance and vector names. Having tailored a plot setup, the user can save the setup as a template definition to file for later reuse.
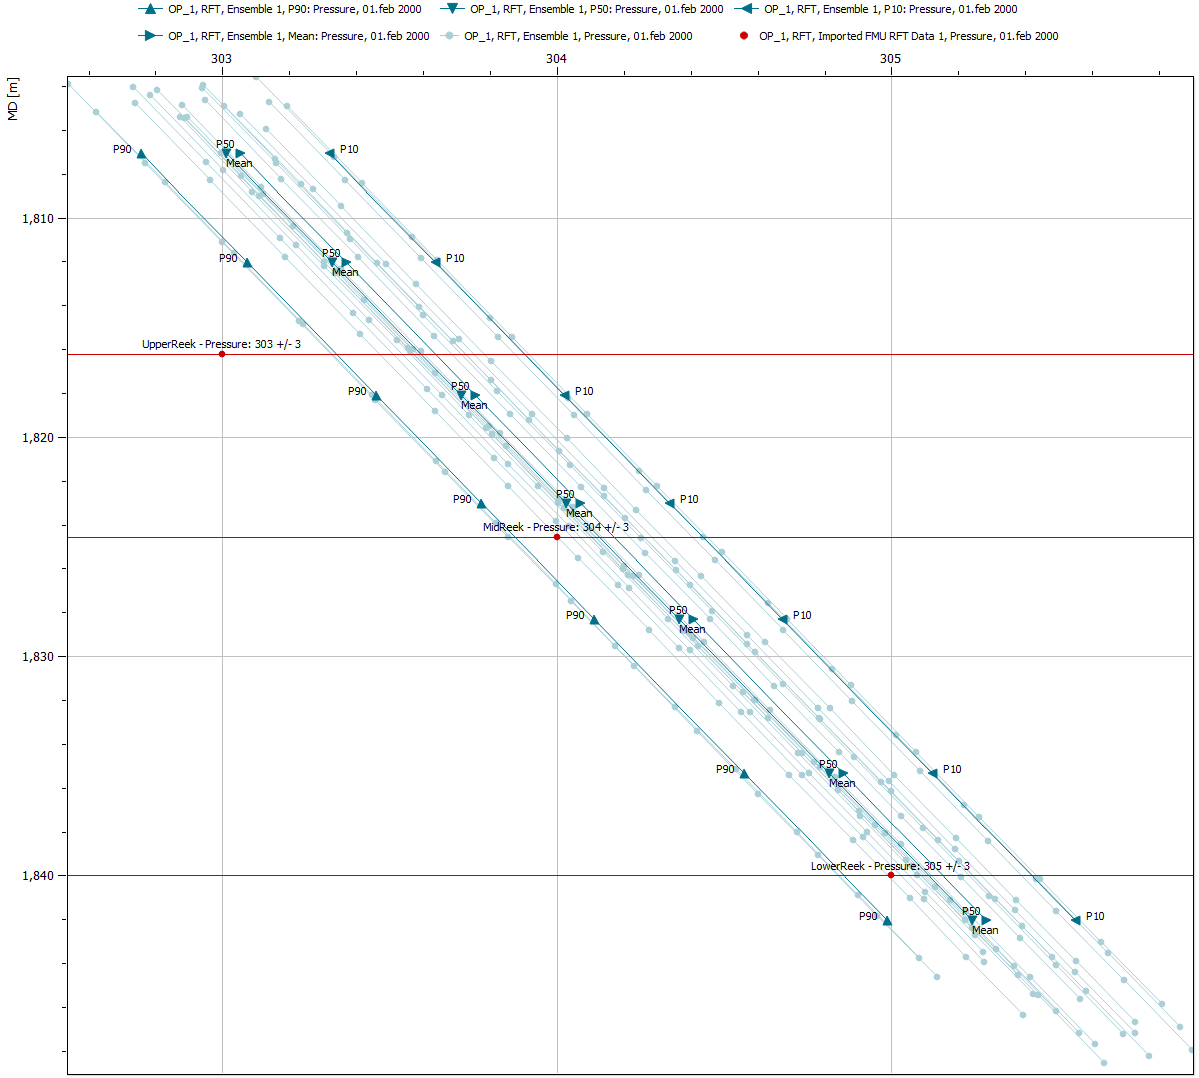
Ensemble RFT data import and plotting
ResInsight allows the user to create a ensemble RFT plot similar to summary ensemble plots. The functionality includes advanced color schemes for differentiation of curves, computation of statistics, and import of observed ensemble RFT data from FMU.
Command line interface for Summary plotting
ResInsight scripting has been extended with summary plotting commands that plot summary vectors based on textual specifications including the use of wildcards for selection and filtering. For more information and examples of use, see Command line interface for Summary Plotting.
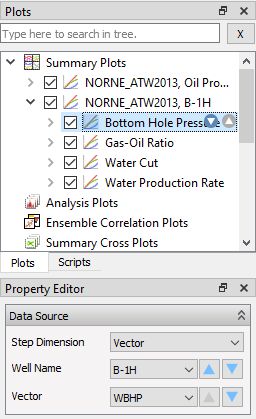
Text-Based Curve Creation and Source Stepping
Text-Based Curve Creation allows specification of a list of vectors for plotting based on selected sources. The history of text-based curve specifications are recorded to allow for effective use.
This is possible to combine with Summary Source Stepping which has been extended to further support swift stepping through multiple vectors.

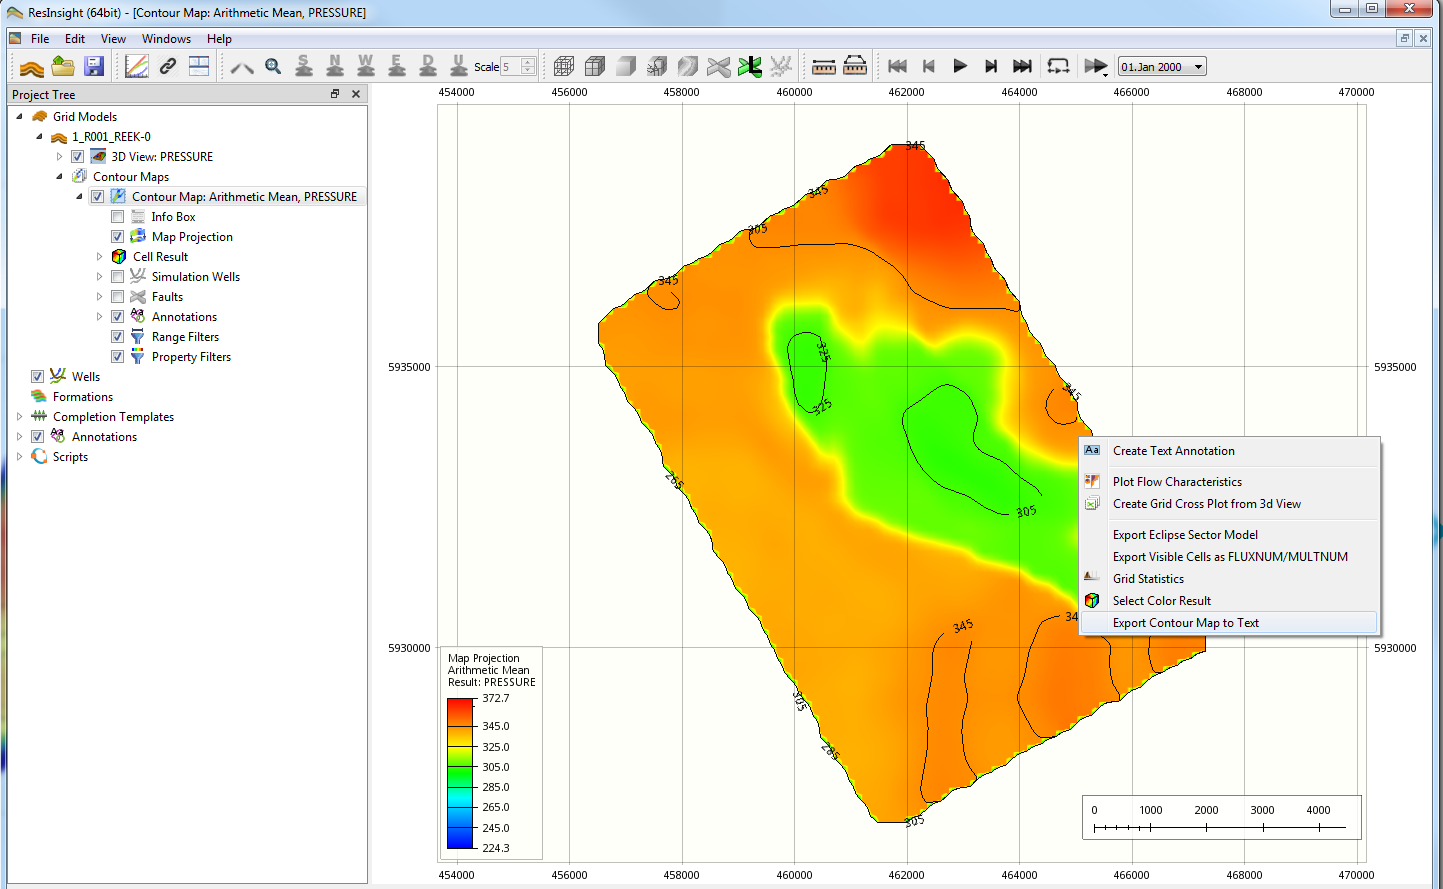
Export Contour plot data
ResInsight can create contour maps based on different forms of aggregation of 3D Eclipse data onto a 2D Plane. Any 3D result value can be aggregated, in addition to specialised results, such as oil, gas and hydrocarbon columns. A Contour Map is a specialised 2D view with many of the same features as the 3D views, including property filters, range filters and display of faults and wells. For more information, see Contour Map Export.
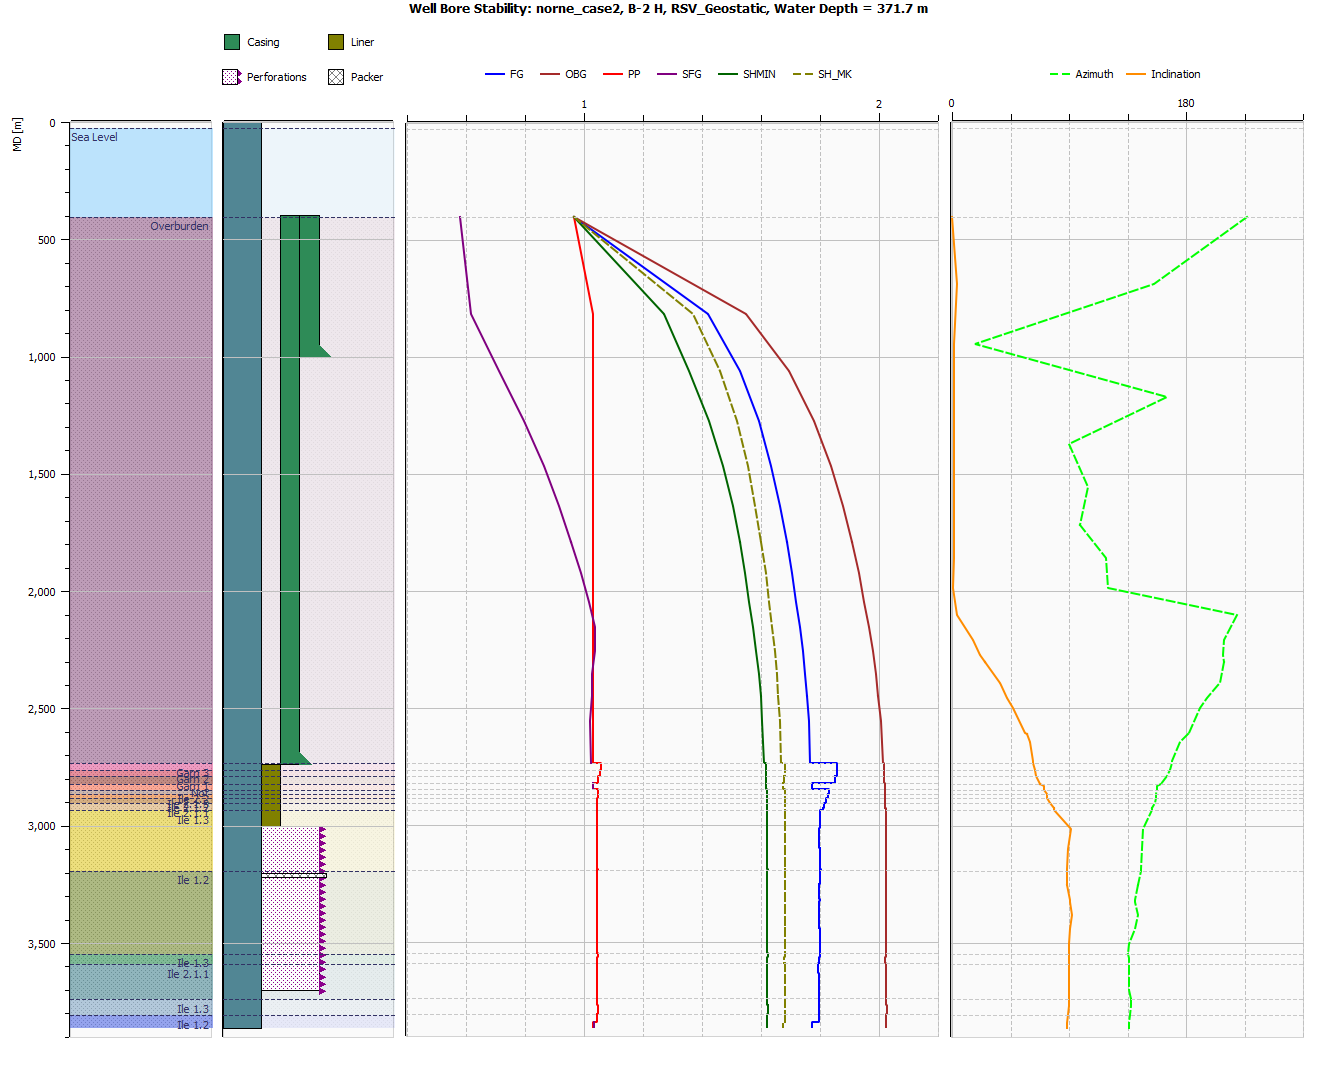
Well Bore Stability plots
Major extensions and enhancements have been added to Well Bore Stability plots for Geomechanical cases. Well Bore Stability plots are specialized Well Log Plots to visualize Formations, Well Path Attributes as well as a set of well path derived curves in different tracks.
Changes in behavior and defaults
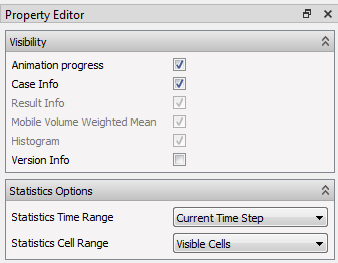
Info Box: Change of defaults for Statistics Options
Following multiple user requests, the defaults for Statistics Options in Info Box have been changed to:
- Statistics Time Range: Current Time Step
- Statistics Cell Range: Visible Cells